ZochSteveo
New Member
- Joined
- Dec 21, 2024
- Messages
- 30
- Office Version
- 2024
- Platform
- MacOS
Hi there,
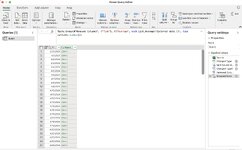
So I have a list of times at intervals of every 5 minutes for about 7 months or so. For each 5 minute interval, there is a corresponding value for the temperature as well. I need to average the values for all recordings of the temperature for each respective day. Is there a fast way of me being able to do this?
The times are as follows for example: 04/01/2024 00:00, 04/01/2024 00:05, 04/01/2024 00:10 etc. and for each time stamp there is a corresponding temperature value. I need to average each temperature value for the whole day, and do this for every day in which there are around 7 months worth,
| Practice Analysis.xlsx | ||||
|---|---|---|---|---|
| A | B | |||
| 3 | Time | External data | ||
| 4 | 1/4/24 0:00 | 8.703 °C | ||
| 5 | 1/4/24 0:05 | 8.743 °C | ||
| 6 | 1/4/24 0:10 | 8.676 °C | ||
| 7 | 1/4/24 0:15 | 8.664 °C | ||
| 8 | 1/4/24 0:20 | 8.743 °C | ||
| 9 | 1/4/24 0:25 | 8.673 °C | ||
| 10 | 1/4/24 0:30 | 8.596 °C | ||
| 11 | 1/4/24 0:35 | 8.569 °C | ||
| 12 | 1/4/24 0:40 | 8.586 °C | ||
| 13 | 1/4/24 0:45 | 8.637 °C | ||
| 14 | 1/4/24 0:50 | 8.595 °C | ||
| 15 | 1/4/24 0:55 | 8.499 °C | ||
| 16 | 1/4/24 1:00 | 8.340 °C | ||
| 17 | 1/4/24 1:05 | 8.421 °C | ||
| 18 | 1/4/24 1:10 | 8.341 °C | ||
| 19 | 1/4/24 1:15 | 8.353 °C | ||
| 20 | 1/4/24 1:20 | 8.191 °C | ||
| 21 | 1/4/24 1:25 | 8.272 °C | ||
| 22 | 1/4/24 1:30 | 8.090 °C | ||
| 23 | 1/4/24 1:35 | 8.115 °C | ||
| 24 | 1/4/24 1:40 | 8.017 °C | ||
| 25 | 1/4/24 1:45 | 8.082 °C | ||
| 26 | 1/4/24 1:50 | 7.971 °C | ||
| 27 | 1/4/24 1:55 | 7.924 °C | ||
| 28 | 1/4/24 2:00 | 7.880 °C | ||
| 29 | 1/4/24 2:05 | 7.918 °C | ||
| 30 | 1/4/24 2:10 | 7.913 °C | ||
| 31 | 1/4/24 2:15 | 7.835 °C | ||
| 32 | 1/4/24 2:20 | 7.916 °C | ||
| 33 | 1/4/24 2:25 | 7.755 °C | ||
| 34 | 1/4/24 2:30 | 7.925 °C | ||
| 35 | 1/4/24 2:35 | 7.922 °C | ||
| 36 | 1/4/24 2:40 | 7.925 °C | ||
| 37 | 1/4/24 2:45 | 7.980 °C | ||
| 38 | 1/4/24 2:50 | 8.001 °C | ||
| 39 | 1/4/24 2:55 | 7.958 °C | ||
| 40 | 1/4/24 3:00 | 7.989 °C | ||
| 41 | 1/4/24 3:05 | 7.960 °C | ||
| 42 | 1/4/24 3:10 | 7.987 °C | ||
| 43 | 1/4/24 3:15 | 8.070 °C | ||
| 44 | 1/4/24 3:20 | 8.032 °C | ||
| 45 | 1/4/24 3:25 | 8.014 °C | ||
| 46 | 1/4/24 3:30 | 7.933 °C | ||
| 47 | 1/4/24 3:35 | 8.032 °C | ||
| 48 | 1/4/24 3:40 | 7.961 °C | ||
| 49 | 1/4/24 3:45 | 7.978 °C | ||
| 50 | 1/4/24 3:50 | 7.913 °C | ||
| 51 | 1/4/24 3:55 | 7.826 °C | ||
| 52 | 1/4/24 4:00 | 7.735 °C | ||
| 53 | 1/4/24 4:05 | 7.623 °C | ||
| 54 | 1/4/24 4:10 | 7.535 °C | ||
| 55 | 1/4/24 4:15 | 7.411 °C | ||
| 56 | 1/4/24 4:20 | 7.298 °C | ||
| 57 | 1/4/24 4:25 | 7.244 °C | ||
| 58 | 1/4/24 4:30 | 7.142 °C | ||
| 59 | 1/4/24 4:35 | 6.968 °C | ||
| 60 | 1/4/24 4:40 | 6.842 °C | ||
| 61 | 1/4/24 4:45 | 6.744 °C | ||
| 62 | 1/4/24 4:50 | 6.770 °C | ||
| 63 | 1/4/24 4:55 | 6.764 °C | ||
| 64 | 1/4/24 5:00 | 6.715 °C | ||
| 65 | 1/4/24 5:05 | 6.554 °C | ||
| 66 | 1/4/24 5:10 | 6.569 °C | ||
| 67 | 1/4/24 5:15 | 6.602 °C | ||
| 68 | 1/4/24 5:20 | 6.488 °C | ||
| 69 | 1/4/24 5:25 | 6.346 °C | ||
| 70 | 1/4/24 5:30 | 6.369 °C | ||
| 71 | 1/4/24 5:35 | 6.246 °C | ||
| 72 | 1/4/24 5:40 | 6.149 °C | ||
| 73 | 1/4/24 5:45 | 5.969 °C | ||
| 74 | 1/4/24 5:50 | 6.063 °C | ||
| 75 | 1/4/24 5:55 | 5.829 °C | ||
| 76 | 1/4/24 6:00 | 5.838 °C | ||
| 77 | 1/4/24 6:05 | 5.836 °C | ||
| 78 | 1/4/24 6:10 | 5.507 °C | ||
| 79 | 1/4/24 6:15 | 5.703 °C | ||
| 80 | 1/4/24 6:20 | 5.620 °C | ||
| 81 | 1/4/24 6:25 | 5.879 °C | ||
| 82 | 1/4/24 6:30 | 5.696 °C | ||
| 83 | 1/4/24 6:35 | 5.598 °C | ||
| 84 | 1/4/24 6:40 | 5.640 °C | ||
| 85 | 1/4/24 6:45 | 5.683 °C | ||
| 86 | 1/4/24 6:50 | 5.773 °C | ||
| 87 | 1/4/24 6:55 | 5.645 °C | ||
| 88 | 1/4/24 7:00 | 5.612 °C | ||
| 89 | 1/4/24 7:05 | 5.580 °C | ||
| 90 | 1/4/24 7:10 | 5.706 °C | ||
| 91 | 1/4/24 7:15 | 5.972 °C | ||
| 92 | 1/4/24 7:20 | 6.006 °C | ||
| 93 | 1/4/24 7:25 | 6.137 °C | ||
| 94 | 1/4/24 7:30 | 6.129 °C | ||
| 95 | 1/4/24 7:35 | 6.266 °C | ||
| 96 | 1/4/24 7:40 | 6.430 °C | ||
| 97 | 1/4/24 7:45 | 6.545 °C | ||
| 98 | 1/4/24 7:50 | 6.936 °C | ||
| 99 | 1/4/24 7:55 | 7.210 °C | ||
| 100 | 1/4/24 8:00 | 7.282 °C | ||
| 101 | 1/4/24 8:05 | 7.429 °C | ||
| 102 | 1/4/24 8:10 | 7.500 °C | ||
| 103 | 1/4/24 8:15 | 7.636 °C | ||
| 104 | 1/4/24 8:20 | 7.747 °C | ||
| 105 | 1/4/24 8:25 | 8.145 °C | ||
| 106 | 1/4/24 8:30 | 8.344 °C | ||
| 107 | 1/4/24 8:35 | 8.433 °C | ||
| 108 | 1/4/24 8:40 | 8.554 °C | ||
| 109 | 1/4/24 8:45 | 8.763 °C | ||
| 110 | 1/4/24 8:50 | 8.875 °C | ||
| 111 | 1/4/24 8:55 | 9.089 °C | ||
| 112 | 1/4/24 9:00 | 9.266 °C | ||
| 113 | 1/4/24 9:05 | 9.658 °C | ||
| 114 | 1/4/24 9:10 | 9.579 °C | ||
| 115 | 1/4/24 9:15 | 9.749 °C | ||
| 116 | 1/4/24 9:20 | 9.764 °C | ||
| 117 | 1/4/24 9:25 | 9.884 °C | ||
| 118 | 1/4/24 9:30 | 10.028 °C | ||
| 119 | 1/4/24 9:35 | 10.180 °C | ||
| 120 | 1/4/24 9:40 | 10.855 °C | ||
| 121 | 1/4/24 9:45 | 10.938 °C | ||
| 122 | 1/4/24 9:50 | 10.917 °C | ||
| 123 | 1/4/24 9:55 | 11.600 °C | ||
| 124 | 1/4/24 10:00 | 12.050 °C | ||
Sheet1 | ||||