
Summary of Summarize Data Week
April 14, 2018 - by Bill Jelen

For the last five days, I showed five different ways to create a customer summary from a detailed data set. Now it is time to vote for your favorite.
The goal is to summarize a 563-row data set so you have one row per customer.
This week featured five different ways to solve the problem.
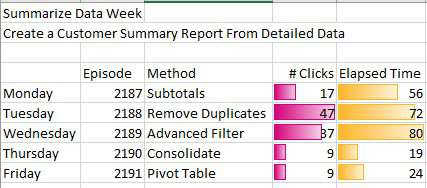
- Monday: Summarize Data with Subtotals
- Tuesday: Summarize Data with Remove Duplicates
- Wednesday: Summarize Data with Advanced Filter
- Thursday: Summarize Data with Consolidate
- Friday: Summarize Data with Pivot Tables
- Today: Summary of Summarize Data Week
There are likely other methods that I missed. Power Query. Microsoft Query.
Watch Video
Here is the summary of how long each method took, both in clicks+keystrokes and elapsed time.
But speed is not the whole story. Depending on if your underlying data is going to change, you might prefer a method that is easier to refresh.
I would like you to vote for the method that is your favorite. Vote here.
The results will be posted here in a few days.
This week is Summarizing Data week. Each day, we will look at five different ways to solve a problem.
Excel Thought Of the Day
I've asked my Excel Master friends for their advice about Excel. Today's thought to ponder:
"They don't call it Paste Special for nothing."
Title Photo: William Iven / Unsplash