
Show Months with Zero Sales
February 01, 2023 - by Bill Jelen

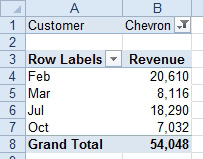
Problem: I built a pivot table to show sales by month for one customer. For the large customers, I get all 12 months.
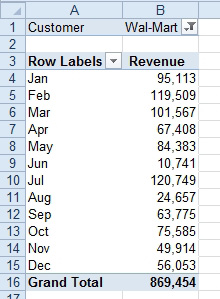
But for the smaller customers, I don’t see all of the months. I was thinking of adding 12 dummy records for every customer, one per month, but with 300 customers, that would be 3600 fake records just to solve this stupid problem.
Strategy: Select a cell in the data column. Click the Field Settings icon in the Analyze tab. This time, go to the second tab in the dialog, called Layout and Print. On that tab, click Show Items With No Data.
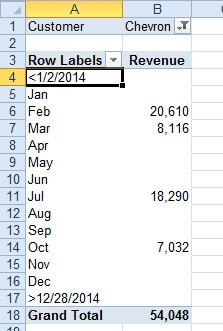
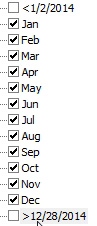
Gotcha: You are not done yet. The months now appear, but they are empty cells instead of zero. Also, a strange entry appears at the top and the bottom of the data set. There are no records in the data set before 1/1/2014, so this is a pure annoyance from Microsoft.
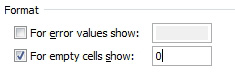
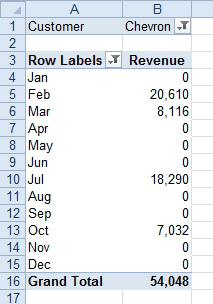
To fix the empty cells, right-click the pivot table and choose Options. Fill in the For Empty Cells Show box with a zero.
Go to the filter dropdown for Dates. Uncheck the <1/1/2014 and the >12/29/2014 entries.
The result: a pivot table that will show all 12 months for every customer.
This article is an excerpt from Power Excel With MrExcel
Title photo by Glen Carrie on Unsplash