
Random Walk Down Wall Street - Random Functions
February 14, 2022 - by Bill Jelen

The examples in the previous article, Sensitivity Analysis with 100K Formulas ,show the classic use of the Data Table function. However, while judging the ModelOff World Financial Championships in New York in 2012, I met professor Simon Benninga and he demonstrated a very different use for data tables.
First, build a column that represents 100 coin flips. If the RAND() is > .5 then you win a penny, otherwise you lose a penny. Add a graph. Every time you press F9, Excel runs the 100 coin flips again and the graph updates.
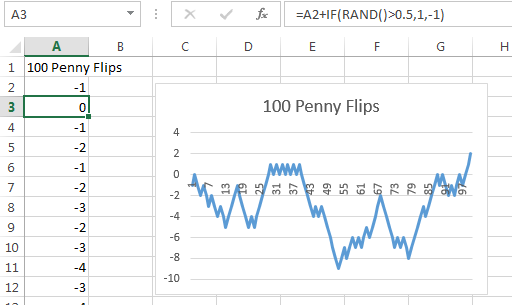
You might be interested in some statistics from these 100 coin flips. What was the highest you were ever ahead? What was the lowest you were ever behind? Where did you finish after 100 coin flips. Set up formulas going across a row with =MAX(A2:A101), =MIN(A2:A101), and =A101.
Now - say that you want to run the 100 coin flip experiment 1000 times. Select the blank cell to the left of your formulas, the three formulas, and then 1000 blank rows below. Select Data, What-If, Data Table. You will leave the Row Input Cell blank. For the Column Input Cell, choose any blank cell outside of the table.
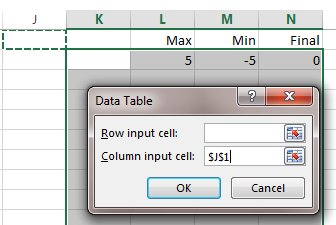
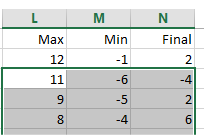
This is a seemingly bizarre request. You are telling Excel to take the 1000 blank cells in K2:K1001, plug them in to the blank J1 cell, and record the results of the Max, Min, and Final. Since those cells are the results of formulas containing =RAND() or =RANDBETWEEN(), each row in the resulting data table represents the results of 100 coin flips. In all, you’ve effectively modeled 100,000 coin flips.
This technique works because your model is based on one of the random functions.
This article is an excerpt from Power Excel With MrExcel
Title photo by Efe Kurnaz on Unsplash