
Prevent the Drop to Zero
July 07, 2023 - by Bill Jelen

Problem: I’ve built formulas to create a chartable range. I want to show how the fund balances have been increasing for three years. All of a sudden, the points for future months look like someone spent all the money, dropping to zero.
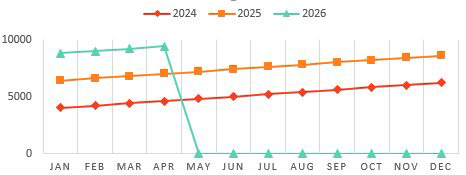
Strategy: Zero cells will be plotted. Empty cells or #N/A! cells will not be plotted. Change your formulas to put an NA() instead of 0. Say that you are building the chart range with =SUMIF(). Start to use =IF(SUMIF()=0,NA(),SUMIF()). The chart will look much better.
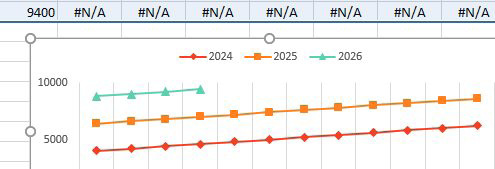
It is ironic that 99% of the time, you are trying to avoid the #N/A. In this case, however it solves the problem.
This article is an excerpt from Power Excel With MrExcel
Title photo by the blowup on Unsplash