
Power Map From Two Data Sets
June 21, 2018 - by Bill Jelen

A question from my Melbourne Florida Power Excel seminar: Is it possible to display two different data sets in Excel Power Map (Excel 2013) or Excel 3D Map (Excel 2016+)? I knew this was possible because I've seen it in a Microsoft demo. I just wasn't sure how Microsoft did it.
The trick is to add each data set to the workbook Data Model before creating the map.
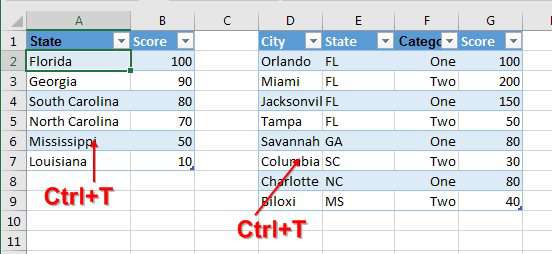
First, select one cell in your first data set. Press Ctrl + T to Format as Table. Make sure that box for Use First Row as Headers is checked. Repeat for the second table.
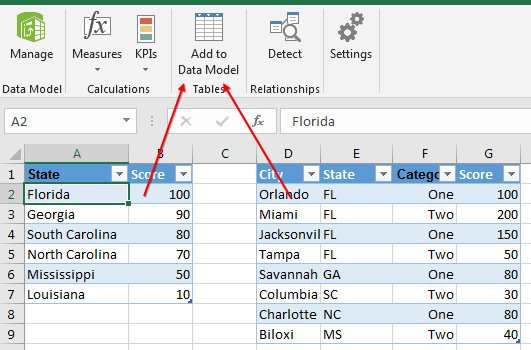
Adding the data to the data model could be very simple if you have a tab in the Excel ribbon called Power Pivot. In May 2018, Microsoft announced that all versions of Office 365 would soon have this tab. If you own the perpetual version of Office 2013 or Office 2016, you might not have the tab. If you have the Power Pivot tab, follow these steps:
Select one cell in the first table. Select Power Pivot, Add to Data Model. Select one cell in the second table. Select Power Pivot, Add to Data Model.
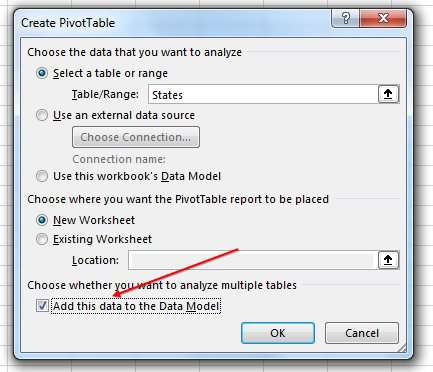
If you do not have the Power Pivot tab, you can still get the data in to the data model. Follow these steps:
- Select one cell in the first table.
- Insert, Pivot Table
- In the Create PivotTable dialog, choose Add This Data To The Data Model. Click OK.
- In the Fields list, choose any field to create a temporary pivot table.
- Repeat steps 1-4 for the second table.
Note
You could also get the data in to the data model using the From Table icon in the Get & Transform group on the Data tab. Select one cell in the data. Use From Table. Choose Edit. On the Home tab in Power Query, open the dropdown for Close & Load To... In the Close & Load To dialog, choose the boxes for "Only Create Connection" and Add to This Workbook's Data Model.
Now that you have both tables in the Data Model, you can move to Power Map.
- Select a blank cell that is not in either data set.
- On the Insert tab, choose Power Map (Excel 2013) or 3D Map (Excel 2016+).
-
When Power Map opens, you will see the Field List is offering fields from both data sets. Drag fields to create the map from the first data set.
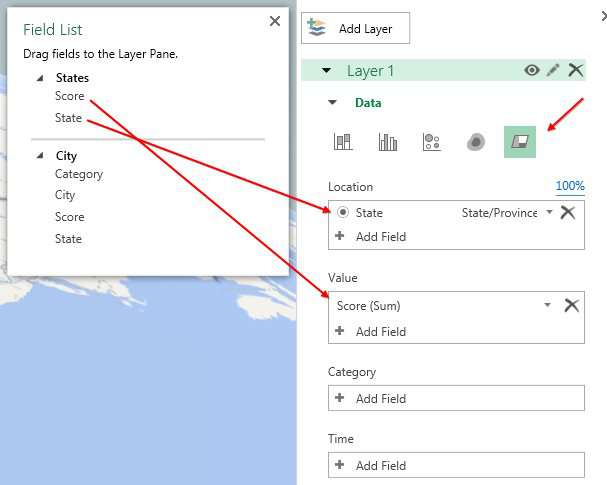
Build the first layer -
Then, click the Add Layer button. Create the map from the second data set.
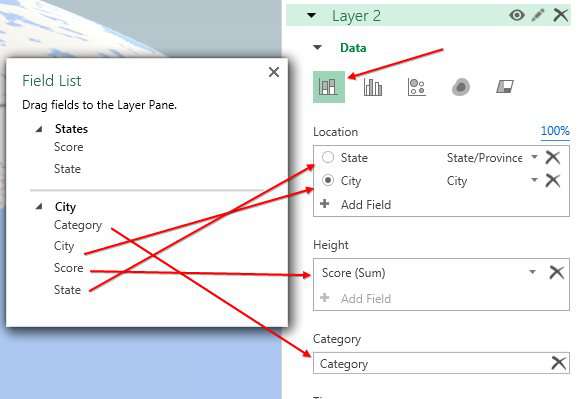
Build the second layer
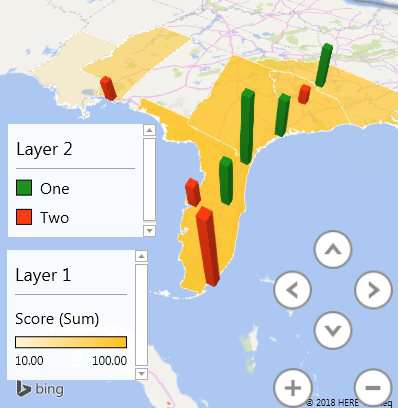
The result: data from two data sets on a single map:
Watch Video
Video Transcript
Learn Excel from MrExcel Podcast, Episode 2218: Power Map From Two Data Sets.
Hey, welcome back to the MrExcel netcast, I'm Bill Jelen. I usually do these Power Excel seminars and I always show a couple of Power Map examples. But I actually had someone in the audience the other day in Melbourne, Florida, who's been trying to use Power Map and had a question for me that I wasn't really sure of: How do you get two different layers-- two different data sets-- on a map? And here's the way I found to do it. I'll be interested in the YouTube comments to see if someone has a better way.
So I have these two different data sets-- one by State and one by City-- and so I want to create a field map from this and a column chart from this. First thing I want to do is, I'm going to make both of them into a table with Ctrl+T-- Table1, horrible name, let's call this States-- and then Ctrl+T and rename this City. Now, what I have to do is I have to-- before I start Power Map-- I have to get both of these into the data model. If I'm lucky enough to have the Power Pivot tab, well, then it'll be really easy. Just click Add Data Model-- Add Data Model.
Well, let's say you don't have this tab. Okay. So here's my cheap and dirty way to do this: Insert, PivotTable, Add this data to the Data Model, and that just creates some sort of a PivotTable. I don't care, I just need to get the data into the data model. Then come over here, same thing: Insert, PivotTable, Add this data to the Data Model. I'll actually put this one on the same worksheet that no one will ever see. I'll hide this worksheet or something like that, click OK, and again, just some sort of data there like that-- beautiful. Alright. Now, now that I have both of those in the data model, when I go to Insert, Power Map or 3d Map-- success. What I have now, is both categories, so I'll build the City first-- City and State like this-- and we'll say the color is going to be the category and then the score is going to be the height. Alright. So there's our first map, and then I'm going to say, Add a Layer, and for Layer 2 I'll use State. and this will be a filled area map, and our score will be the value-- score, and the score will be the value. Alright, so we get the different shapes there. Now, that really-- that is an ugly... that is the ugliest color I've ever seen. So, let's see if we can find some way to change that color-- that's down here under Layer Options. Instead of being based on a purple, I'll just go with some other color like that-- maybe something darker so I could see the changes. Alright. So Florida has the highest score, Louisiana has the lowest score. Alright. Oh, and I missed Alabama completely. Alright. So that's it.
Whole trick to this is to get both datasets into the data model. Again, if you have the PowerPivot tab, that's easy-- just choose one data set, Add to Data Model, choose the other data set, Add to Data Model. But if you don't, then in Excel 2013 or 16, Insert, PivotTable, Add this data to the Data Model, would work. Or, heck, even Power Query-- Data, From Table, and then Close & Load, to add this data to the Data Model. So lots of different ways to get both tables in there, but if you don't put both tables in the data model before you head to Power Map, it's just never going to work.
Yeah, my new book, MrExcel LIVe, The 50 Greatest Excel Tips of All Time, includes some Power Map examples-- check that out. Click the "I" on the top right hand corner for information about that.
Wrap-up of today's episode: How can you build a power map with two different data sets? You have to get both tables into the data model and you can do that one of three ways-- either with Power Query, Power Pivot, or just create a Pivot Table and choose that box that says Add this data to the Data Model. Do that for both tables. And when you launch Power Map you can build the first map, and then click Add Layer, and use the other data set.
To download the workbook from today's video, visit the URL in the YouTube description. I want to thank you for stopping by, I'll see you next time for another netcast from MrExcel.
Download Excel File
To download the excel file: power-map-from-two-data-sets.xlsx
Excel Thought Of the Day
I've asked my Excel Master friends for their advice about Excel. Today's thought to ponder:
"A watched macro never finishes (set that ScreenUpdating to false)"
Title Photo: John-Mark Smith on Unsplash