
Perfect 1-Click Charts
July 24, 2017 - by Bill Jelen

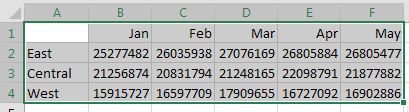
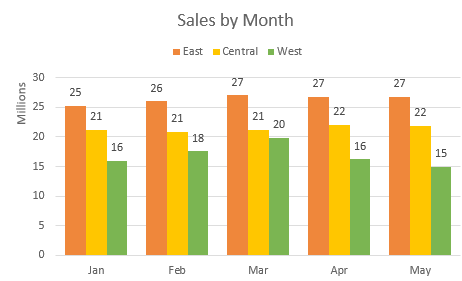
You do not have to re-create your charts each month
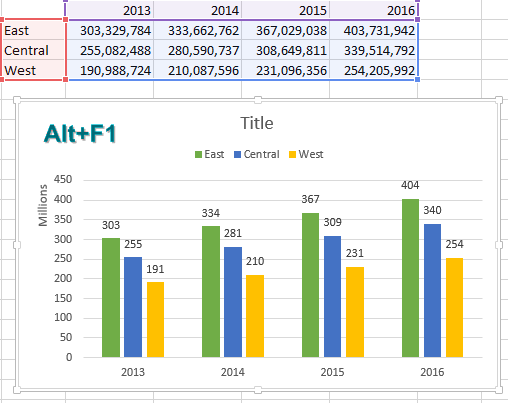
One-click charts are easy: Select the data. Press Alt + F1.
But one-click charts are rarely the type of chart you need to create day after day. To make your life easier, you can change the settings on a chart and then teach Excel to produce your favorite chart in response to Alt + F1.
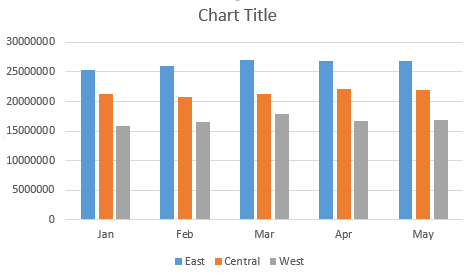
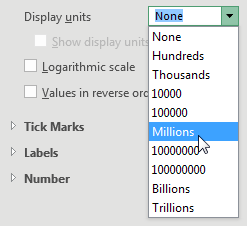
Say that you want to clean up the chart above. All of those zeros on the left axis take up a lot of space without adding value. Double-click those numbers. Change Display Units from None to Millions.
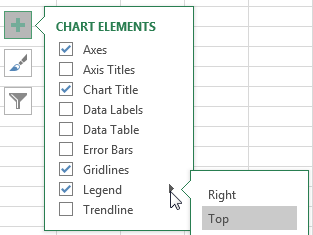
To move the legend to the top, click the+sign next to the chart, choose the arrow to the right of Legend, then choose Top.
Change the color scheme to something that works with your company colors.
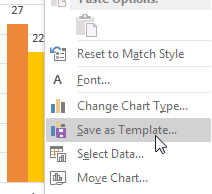
Right-click the chart and choose Save As Template. Then, give the template a name. (I called mine ClusteredColumn.)
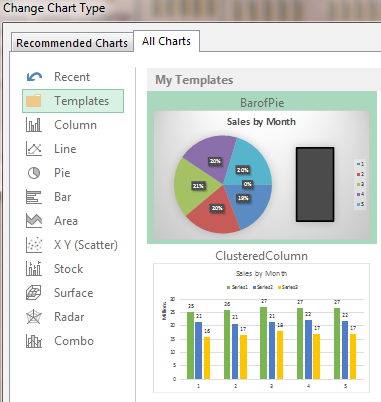
Select a chart. In the Design tab of the ribbon, choose Change Chart Type. Click on the Templates folder to see the template that you just created.
Right-click your template and choose Set As Default Chart.
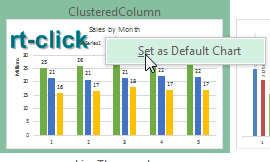
The next time you need to create a chart, select the data and press Alt + F1. All your favorite settings will appear in the chart.
Thanks to Areef Ali, Olga Kryuchkova, and Wendy Sprakes for suggesting this feature.
Watch Video
- You do not have to re-create your charts each month
- Type the new data near the old data
- Select the new data including the heading
- Ctrl + C to copy
- Select the chart
- Ctrl + V to paste the new data on the Excel chart
- To remove data use the blue handles
- To remove the center series you can hide the row
- To remove the center series, select it and press Delete
- To remove a series in 2013 or newer, use the Funnel icon
Download File
Download the sample file here: Podcast1989.xlsx
Title Photo: Pixabay