
Power Query: Dealing with Multiple Identical Headers
February 25, 2020 - by Bill Jelen
Note
This is one of a series of articles detailing solutions sent in for the Podcast 2316 challenge.
In my original data shaping problem, I ran into a problem very early in the process. The incoming data was going to have many columns with a heading of Q1.
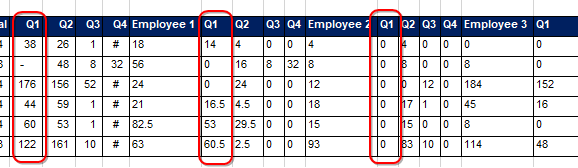
In my solution, I created a named range “UglyData” and imported that to Power Query. This lead to the unhappy result of Power Query renaming my columns to be Q1_1.
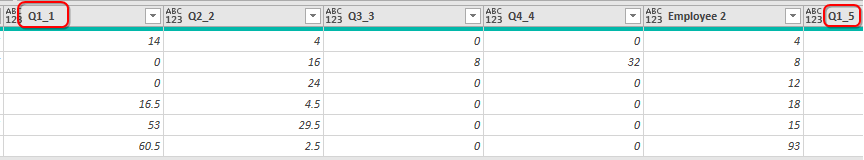
Later, after unpivoting, I had to extract just the left two characters from those headers.
There were three separate solutions to this problem:
- Wyn Hopkins and Demote Headers
- MF Wong and uncheck My Table Has Headers (also suggested by Peter Bartholomew)
- Jason M and simply delete Promoted Headers (also suggested by Ondřej Malinský and Excel MVP John MacDougall)
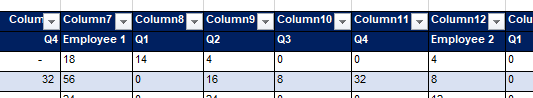
The first innovation was from Wyn Hopkins at Access Analytic. Instead of a named range, Wyn converted the data to a table using Ctrl + T. At this point, the damage to the headings was done, as Excel converted the headings to:
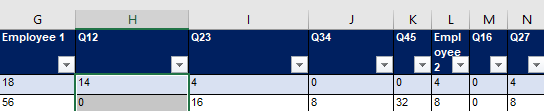
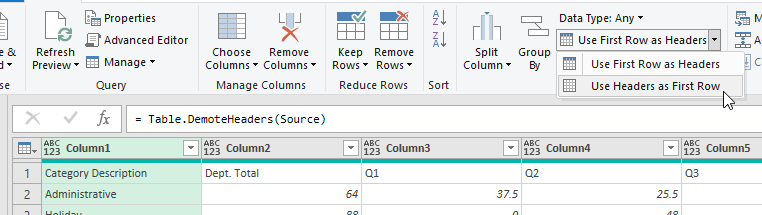
Once Wyn took the data in to Power Query, he then opened the Use First Row as Headers drop-down menu and chose Use Headers as First Row. I never realized this was there. It creates a step called Table.DemoteHeaders.
But, even with Wyn’s improvement, he would still later have to extract the first 2 characters from those headers.
The second innovation is MF Wong’s technique. When he created the table, he unchecked My Table Has Headers!
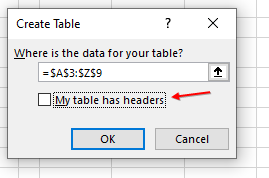
This makes sure that Excel leaves the multiple Q1 headers alone and there is no need to extract the extra suffix later.
I understand there are people in the “I love tables” camp. MF Wong’s video demonstrated how he could add new employees to the right of the data and the table automatically expands. There are a lot of good reasons to use tables.
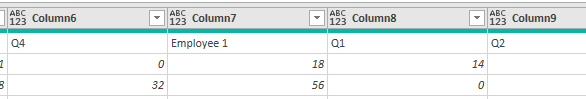
But, because I love Subtotals, Custom Views, and Filter by Selection, I tend to not use Tables. So, I appreciate the solution from Jason M. He kept the data as the named range of UglyData. As soon as he imported the data to Power Query, he deleted these two steps:
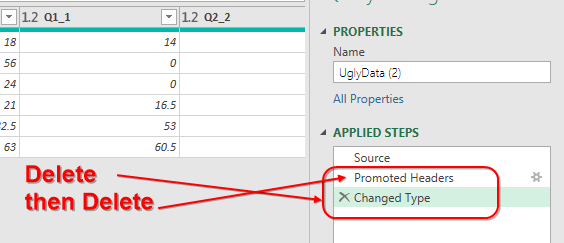
Now, with the data simply in Row 1, there is no hassle having many columns called Q1.
Here is Wyn Hopkin’s code showing DemotedHeaders:
let
    Source = Excel.CurrentWorkbook(){[Name="Table1"]}[Content],
    #"Demoted Headers1" = Table.DemoteHeaders(Source),
    #"Transposed Table1" = Table.Transpose(#"Demoted Headers1"),
    #"Added Custom" = Table.AddColumn(#"Transposed Table1", "Custom", each if Text.Start([Column1],1) = "Q" then null else [Column1]),
    #"Filled Down" = Table.FillDown(#"Added Custom",{"Custom"}),
    #"Filtered Rows" = Table.SelectRows(#"Filled Down", each ([Custom] <> "Dept. Total")),
    #"Filtered Rows1" = Table.SelectRows(#"Filtered Rows", each not Text.StartsWith([Column1], "Employee")),
    #"Promoted Headers" = Table.PromoteHeaders(#"Filtered Rows1", [PromoteAllScalars=true]),
    #"Extracted First Characters" = Table.TransformColumns(#"Promoted Headers", {{"Category Description", each Text.Start(_, 2), type text}}),
    #"Reordered Columns" = Table.ReorderColumns(#"Extracted First Characters",{"Category Description_1", "Category Description", "Administrative", "Holiday", "PTO/LOA/Jury Duty", "Project A", "Project B", "Project C"}),
    #"Unpivoted Other Columns" = Table.UnpivotOtherColumns(#"Reordered Columns", {"Category Description_1", "Category Description"}, "Attribute", "Value"),
    #"Reordered Columns1" = Table.ReorderColumns(#"Unpivoted Other Columns",{"Category Description_1", "Attribute", "Category Description", "Value"}),
    #"Pivoted Column" = Table.Pivot(#"Reordered Columns1", List.Distinct(#"Reordered Columns1"[#"Category Description"]), "Category Description", "Value", List.Sum),
    #"Reordered Columns2" = Table.ReorderColumns(#"Pivoted Column",{"Attribute", "Category Description_1", "Q1", "Q2", "Q3", "Q4"}),
    #"Renamed Columns" = Table.RenameColumns(#"Reordered Columns2",{{"Attribute", "Cat Deasc"}, {"Category Description_1", "Emp Name"}}),
    #"Changed Type" = Table.TransformColumnTypes(#"Renamed Columns",{{"Emp Name", type text}, {"Q1", Int64.Type}, {"Q2", Int64.Type}, {"Q3", Int64.Type}, {"Q4", Int64.Type}}),
    #"Inserted Sum" = Table.AddColumn(#"Changed Type", "Total", each List.Sum({[Q1], [Q2], [Q3], [Q4]}), Int64.Type)
in
    #"Inserted Sum"
Return to the main page for the Podcast 2316 challenge.
Read the next article in this series: Power Query: Delete this, Delete those, or delete nothing?.