
Group Daily Dates by Month in a Pivot Table
December 26, 2022 - by Bill Jelen

Problem: My data set has a date on which each item was shipped. When I produce a pivot table with the date field, it provides sales by day. My plant manager loves sales by day, but everyone else in the company would rather see sales by month.
Strategy: You can group daily dates to show year, quarter, and month. To do so, you build a pivot table with dates in the Row area of the pivot table:
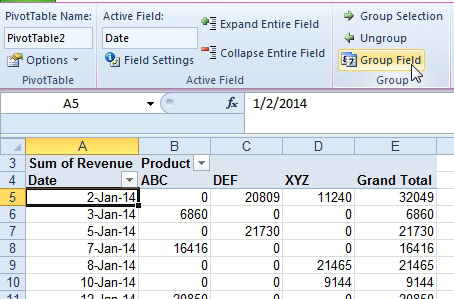
1. Select a cell that contains a date. Click the Group Field icon in the Analyze tab. Excel displays the Grouping dialog.
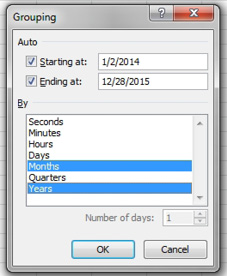
2. The Grouping dialog defaults to selecting months. If your data spans more than one year, it is crucial that you also select years. Select Months and Years. If you don’t choose Years, Excel will group January from one year and January from another year into a single value called January.
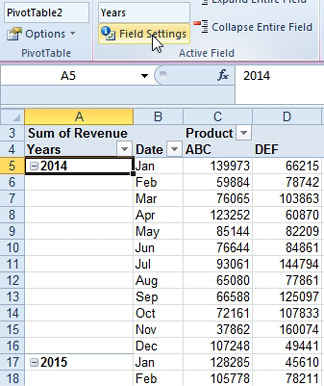
The Date field is now replaced with Months. There is a field called Years. Years and Months are shown in the pivot table, although the pivot table is not showing subtotals for each year.
3. To add the subtotals for the years field, select a years field, then choose Field Settings as shown.
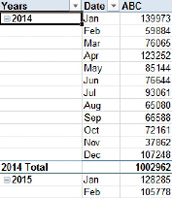
4. In the Field Setting dialog, change Subtotals from None to Automatic.

The result is a report with a subtotal for each year.
This article is an excerpt from Power Excel With MrExcel
Title photo by Ralph Mayhew on Unsplash