
Geography, Stock, and Exchange Rate Data Types
July 28, 2022 - by Bill Jelen

Office 365 subscribers will see a new Data Types gallery appear on the Data tab of the ribbon starting in late 2018 or early 2019. Initially, the feature is supporting geography and stock data types, but there are hopes that they will expand to other data types, including the ability for a company to define their own data types.
Gotcha: the new data types work better when you format the data as a Ctrl+T table. Although I generally try to avoid tables, I will use them in this example.
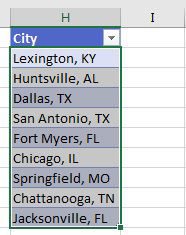
Start with a column of locations. This can be countries, states, counties, or cities. Select the table and press Ctrl+T to define it as a table.
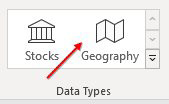
On the Data tab, select Geography.
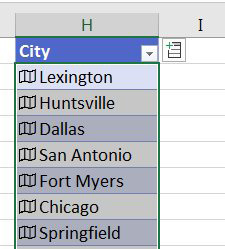
If there are no misspellings, a map icon will appear for each cell. Notice that the original text is replaced with new text. Since there are many different places named Springfield, I am not sure that I like that Excel removed Missouri from Springfield.
Click the map icon for any cell and a floating data card appears with all of the information that Excel knows about that city. My initial joke was that the card was useless, as it just hovered there. But now, you can actually add new fields from the card, so it is better. Click on Population and Excel will add a new column with the population for each city.
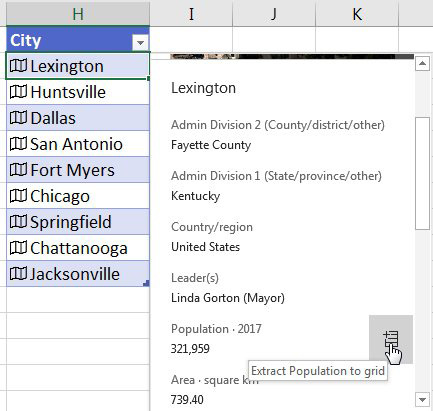
You can also add fields to the table using the icon that appears to the right of the table.
![A formula of =H2.Population puts the population in cell I2. Or, if you have formatted the data as a table, the formula might be =[@City].Population.](/img/content/2022/07/PE19lFig47.jpg)
Data types are an improvement in Excel. One cell can contain essentially an entire row in a lookup table and you can extract that data to the grid using a formula such as =H2.Population. If you go to the cell for Dallas and type Houston instead, the population in column I would update.
Gotcha: Because this data relies on the Internet, the feature is exclusive to Office 365. It will never be in Excel 2016 or Excel 2019.
Additional Details: When you click on Stocks or Geography, Excel looks at the neighboring cells to try to ascertain what you mean by the value in a cell. For example, consider a cell with the word Georgia. If the surrounding cells are countries from the former Russia Republic, then Excel will assume you mean the country of Georgia. If the surrounding cells are states in the southeastern United States, then Excel will assume you mean the state of Georgia.
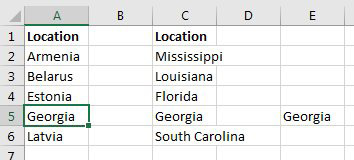
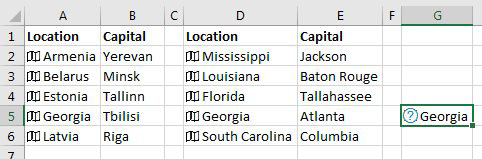
In the figure below, you've added Capital to each location. Excel automatically assigned the correct Georgia in both lists. However - for the lone Georgia in the last column, the map icon is replaced by a question mark, indicating the Excel is not sure what you mean.
Choose the cell with the question mark and a Data Selector appears. You can choose between various matches for Georgia, such as Georgia in the United States, Georgia the country, or Georgia Town in Franklin County, Vermont.
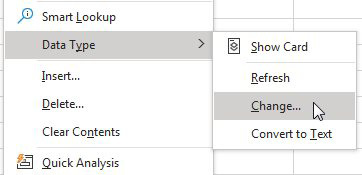
What if you wanted to have the state of Florida and the country of Georgia? Excel won't initially get it correct, but you can force the data selector to appear. Right-click a single cell and choose Data Type, Change.
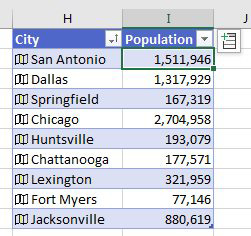
Before moving from Geography to Stocks, here is a benefit of making your data types be a table. When you open the filter drop-down menu for City, a new box appears where you can choose any field. To sort the cities from west to east, select longitude in that box and then Sort Smallest to Largest.
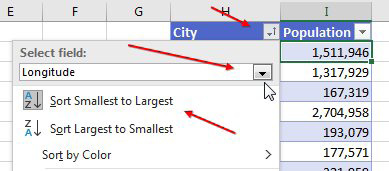
The result is that the cities are organized west to east:
This article is an excerpt from Power Excel With MrExcel
Title photo by GeoJango Maps on Unsplash