
Fine-Tuning 3D Maps
June 05, 2023 - by Bill Jelen

I’ve been using 3D Map since the first beta. Igor Peev and the Power Map team have hidden a lot of good settings inside of the product, even if they are not always evident.
For example, if your data set is ultra-local, down to the point where you are analyzing each house on a street, the default width of the columns is too wide. You can not see the detail for each house, as each column is as wide as a city block.
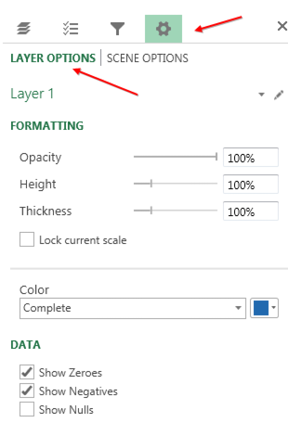
To fix the problem, click the Cog Wheel Icon in the Field List. Then, click Layer Options. You will find a Thickness setting. Change this to 10% and you will be able to see data for each house on the street.
Also in this panel, you can control the color for each category, and control if negatives are shown or not.
Another item that needs editing is the box that shows the current date. It usually starts out showing date and time, even though your data might only be at the date level.
Right-click the box, choose Edit. You can now choose a new font, color, and date format.
To replace the map with a satellite image, open the Themes dropdown and choose the second theme.
An icon in the Ribbon lets you add labels to the map. This adds city names, street names, and so on.
This article is an excerpt from Power Excel With MrExcel
Title photo by GeoJango Maps on Unsplash