
Create Tiny Charts with Sparklines
August 02, 2023 - by Bill Jelen

Problem: I need to create a chart for every row in my data set.
Strategy: Use a sparkline. Professor Edward Tufte introduced the concept of sparklines in his book Beautiful Evidence. Tufte described sparklines as intense word-sized charts. Microsoft implemented Tufte’s ideas in Excel 2010 with three types of tiny charts: line charts, column charts, and win/loss charts.
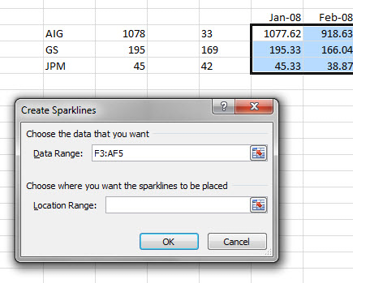
Creating sparklines is simple, although you might want to tweak the default sparklines. Below, there are 27 months of closing stock prices for 3 financial firms. Select the data that you want to plot in the sparklines.
From the Insert tab, choose the Line sparkline.
Excel displays the Create Sparklines dialog. Because you pre-selected the data, you need to specify only the output range. Because the input range is 3 rows by 27 columns, the output range has to either be 3 cells or 27 cells. The size of the output range will determine whether you want 3 sparklines or 27 sparklines.
Gotcha: In the rare case where your input range is exactly square, Microsoft will turn each row into a sparkline. If you want each column to be a sparkline, use the Edit Data dropdown on the Sparkline Tools Design tab and choose Switch Row/Column.
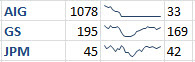
Excel will draw in the line charts, one in each cell. Here are default sparklines.
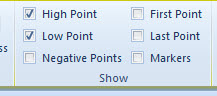
Excel will let you add markers to your sparklines. With a sparkline selected, the Sparkline Tools Design tab will be available in the ribbon. You can toggle on all points by choosing Markers, but a more interesting option is to choose High Point and Low Point
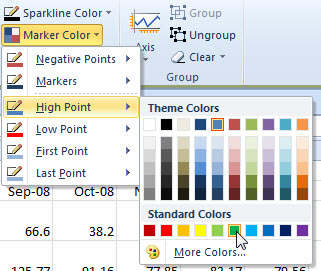
After you’ve added the high and low point, use the Marker Color dropdown to choose a color for each type of point.
This article is an excerpt from Power Excel With MrExcel
Title photo by Cristian Escobar on Unsplash