
Create In Cell Column Chart
November 27, 2001 - by Bill Jelen
A reader from the Czech Republic asked about creating an in-cell chart to illustrate a percentage.
If the value in a cell was 37%, how can I fill 37% of the cell from the bottom with a color?
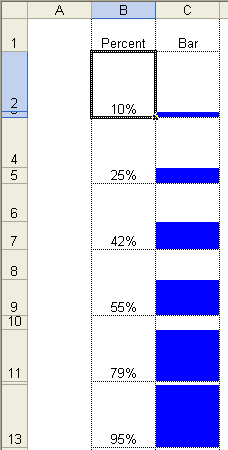
Mala Singh from our Graphics division came up with this interesting solution to produce the desired effect. Mala built a worksheet where each row is actually comprised of 2 merged rows. Cells B2 & B3 are merged together in a single cell. When the value in B2 is changed, a bit of VBA code in the worksheet pane will automatically adjust the height of row 2 & row 3. Cell C3 is colored blue and cell C2 is colored white. The effect is that column C appears to show a column chart in the cell. This image shows various heights of the blue bar in cells C2 through C13.
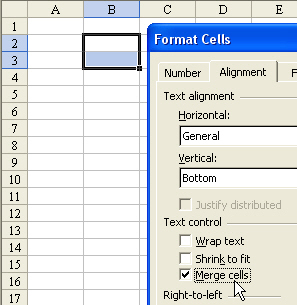
The first step is to merge cells B2 & B3 into a single cell. You will select cells B2 & B3. From the menu, select Format, Cells. Go to the Alignment tab. Check the box for Merge cells. This will cause B2 & B3 to act as a single cell called B2.
Leave cell C2 with no fill and use any color fill for cell C3.
Code for this technique is not placed in a regular module. It is "event handler" code and must be placed on the code module for this particular worksheet. Read Event Macro to Add Path and Filename to Excel Header article for a visual of how to open the code module for a worksheet.
Enter the following code on the code module for Sheet1 (or whatever sheet you are working with).
Private Sub Worksheet_Change(ByVal Target As Range)
  Dim cell As Range
  For Each cell In Target.Cells
    If cell.Column = 2 And cell.Row > 1 Then
      If cell.Value > 1 Or cell.Value < 0 Then
        cell.Select
        MsgBox ("Value must be between 0 and 100%")
      End If
      If IsEmpty(cell) Or cell.Value = 0 Then
        cell.Range("B1:B2").RowHeight = 25
        'cell.Range("B2").Interior.ColorIndex = xlNone
      Else
        On Error Resume Next
        cell.Range("B1").RowHeight = 50 * (1 - cell.Value)
        With cell.Range("B2")
          .RowHeight = 50 * cell.Value
          '.Interior.Color = RGB(0, 0, 255)
          On Error GoTo 0
        End With
      End If
    End If
  Next
End Sub
You can repeat the process of merging pairs of cells in column B.
Thanks to Mala Singh for this solution. Mala can design custom charting solutions to meet any need. He contributed to the charting chapter in VBA and Macros for Excel.