
Create an Ad-Hoc Reporting Tool
January 05, 2023 - by Bill Jelen

Problem: I have an operations manager who is famous for asking many ad hoc questions. One day, he will want to know who bought XYZ product. The next day, he will want to know all sales to Air Canada. How can Excel help me quickly answer his questions?
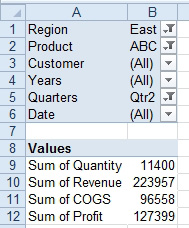
Strategy: You can build a pivot table report with many fields in the Report Filter area. You can then use the information here to answer just about any ad hoc query your manager can dream up. For example, your operations manager can easily figure out how many ABC products were shipped to the East region on a given date.
Additional Details: Take the Date field to the row labels area, group it up to Years, Quarters, and Months, then drag those fields to the Report Filter area.
Alternate Strategy: The Slicer feature introduced in Excel 2010 produce a modern way to filter a pivot table. See Add Visual Filters to a Pivot Table or Regular Table.
This article is an excerpt from Power Excel With MrExcel
Title photo by Nathan Dumlao on Unsplash