
Click in one Chart to Filter Other Charts
April 10, 2023 - by Bill Jelen

When you are viewing a report, clicking a column in one chart will cause all of the other charts to be filtered to that item.
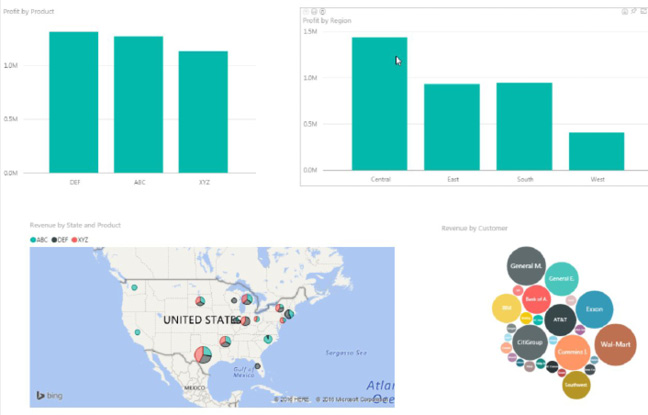
Here is a report with four elements:
Click on the South region in the top right column. The top left chart will grey out the portions of the revenue that are not from the South. The bottom two visualizations will show only customers in the South.
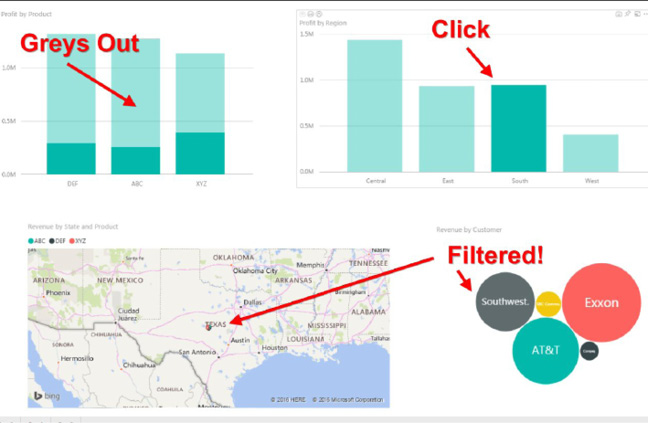
Click again on South to return to an unfiltered state.
Note that you could have chosen to click on product DEF in the top left chart instead. The other three charts would be filtered.
This article is an excerpt from Power Excel With MrExcel
Title photo by Алекс Арцибашев on Unsplash