
Classify Your Geography Fields in Power BI Desktop
April 27, 2023 - by Bill Jelen

Before you begin building visualizations, take a few minutes to classify fields in your data.
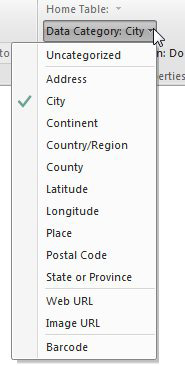
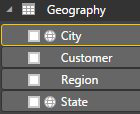
Click on the Geography table in the Fields list to see the fields available in that table. Click on the field for City. In the Modeling tab, open the Data Category drop-down and choose City. Repeat for State.
After defining the fields, a globe icon will appear next to the field in the Fields list.
The other interesting field is the Image URL. If you have a product table with links to product images, you can mark that column as an Image URL. Some visualizations will be able to show the product image instead of the product name.
This article is an excerpt from Power Excel With MrExcel
Title photo by Marc Schulte on Unsplash