Hi there,
In excel I create Waterfall charts using the Peltier method Excel Waterfall Charts (Bridge Charts) - Peltier Tech Blog
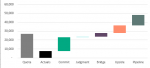
I am trying to create a waterfall chart in Power BI and am finding the Waterfall visualisation chart is too limiting. In the waterfall I want to create, i need to bring in fields from different tables eg actuals, quota, commit etc.
I want Quota fixed on the left, then I want to build Actuals, Commit, Judgment, Bridge, Upside & Pipeline.
Not sure if I am explaining this well but does anyone have suggestions how I can build this in Power BI?
In excel I create Waterfall charts using the Peltier method Excel Waterfall Charts (Bridge Charts) - Peltier Tech Blog
I am trying to create a waterfall chart in Power BI and am finding the Waterfall visualisation chart is too limiting. In the waterfall I want to create, i need to bring in fields from different tables eg actuals, quota, commit etc.
I want Quota fixed on the left, then I want to build Actuals, Commit, Judgment, Bridge, Upside & Pipeline.
Not sure if I am explaining this well but does anyone have suggestions how I can build this in Power BI?