Hi all
I'm new on this forum, but have a little experience with Excel VBA coding.
I struggle to find out what is causing a certain behaviour.
When running the code below, which is started with a Button on sheet 1, the graphs on sheet 2 are changed.
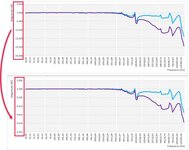
The Y-axis of the graphs, gives values that are divided by 1000, instead of the original values. (see picture in attachment)
Even when changing the variables (for example max and min in the settings) within Excel, the fault is still happening.
The only way to fix it, is the re-start the workbook.
This fault is visible when exporting to PDF and printing.
Also with different laptops and office 365/2021.
I have googled and searched multiple message boards, but I'm out of ideas.
Does anybody has an idea what could cause this?
Thanks!
BR
Stijn
I'm new on this forum, but have a little experience with Excel VBA coding.
I struggle to find out what is causing a certain behaviour.
When running the code below, which is started with a Button on sheet 1, the graphs on sheet 2 are changed.
VBA Code:
ActiveWorkbook.SaveAs fileName:= _
totalDirectory & ".xlsm", _
FileFormat:=xlOpenXMLWorkbookMacroEnabled, CreateBackup:=False
The Y-axis of the graphs, gives values that are divided by 1000, instead of the original values. (see picture in attachment)
Even when changing the variables (for example max and min in the settings) within Excel, the fault is still happening.
The only way to fix it, is the re-start the workbook.
This fault is visible when exporting to PDF and printing.
Also with different laptops and office 365/2021.
I have googled and searched multiple message boards, but I'm out of ideas.
Does anybody has an idea what could cause this?
Thanks!
BR
Stijn