VBA code to draw rectangles sized according to table data

KarolisZ7

New Member
Joined
Mar 5, 2020
Messages
11
Office Version
  1. 2016
Platform
  1. Windows
Hello guys,

First of all, I believe this might be a difficult task so I would really, really appreciate someone who would take a look at this.

I have 5 individual rows of 10 data values which are widths in cm of specific items (products) (50 in total):
L11:U11
L16:U16
L21:U21
L26:U26
L31:U31

What I need is a code which would draw rectangles (one for each data value) based on the width of the item found in the corresponding cell.
Each rectangle would be 2 cm in height
For example:
The rectangle for cell L11 would be 2 cm in height and 1.7 cm in width ... as cell L11 has the value 17.0 cm in it (that should be divided by 10 as rectangle 17 cm wide is visually unnecessary)
The rectangle for cell M11 would be 2 cm in height and 1.65 cm in width ... as cell M11 has the value 16.5 cm in it (once again divided by 10)

...and so on till cell U11 and for other rows.

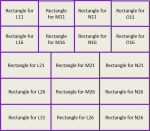
Additionally, rectangles would be placed in the same pattern as mentioned rows are located on excel except the rows themselves would be placed near each other.

It is also has to be said mentioned cells might sometimes have no values inserted in them. Either way, lets say there are values inserted in L11:O11, L16:O16, L21:N21 L26:N26, L31:N31 (all width sums equal to specific number of centimeters) final outcome would look like this:

example.png
 

Attachments

  • example.png
    example.png
    12.3 KB · Views: 26

Excel Facts

Show numbers in thousands?
Use a custom number format of #,##0,K. Each comma after the final 0 will divide the displayed number by another thousand
Try this :
VBA Code:
Public Sub CreateRectangles()
  Dim c, rng as Range, sht As Worksheet, sRow, cRow, sCol, cCol As Double, cht As Chart, TmpRng() As String, nRow As Boolean

  Set sht = Sheets("KarolisZ7")  ' This should be the name of your sheet with the measurements...
  Set rng = sht.Range("L16:O16, L11:O11, L26:U26, L21:U21, L31:U31") ' These are the ranges you provided, and do not need to be in order...

  Set cht = Charts.Add
  TmpRng = Split(rng.Address, ",")
  Call Quicksort(TmpRng, LBound(TmpRng), UBound(TmpRng))
  Set rng = sht.Range(Join(TmpRng, ", "))
  sRow = -1
  cRow = 0
  sCol = 0
  cCol = 0

  For Each c In rng.Cells
    If cRow <> c.Row Then
      sRow = sRow + 1
      cRow = c.Row
      sCol = cCol
    End If
    With cht.Shapes.AddShape( _
      msoShapeRectangle, _
      sCol, _
      Cm2Point(2 * sRow), _
      Cm2Point(c.Value / 10), _
      Cm2Point(2))
        .Fill.Transparency = 0
        .Fill.ForeColor.RGB = RGB(255, 225, 255)
        .Line.Weight = 3
        .Line.ForeColor.RGB = RGB(112, 48, 160)
        .Name = "Cell:" & c.Address & "; Length = " & c.Value
    End With
    sCol = sCol + Cm2Point(c.Value / 10)
  Next c
  Set sht = Nothing
  Set rng = Nothing
End Sub
Public Function Cm2Point(cm As Double) As Double
  Cm2Point = CSng(cm * 28.3145)
End Function

Public Sub Quicksort(values As Variant, min As Long, max As Long)

  Dim med_value As String
  Dim hi As Long
  Dim lo As Long
  Dim i As Long

  ' If the list has only 1 item, it's sorted.
  If min >= max Then Exit Sub

  ' Pick a dividing item randomly.
  i = min + Int(Rnd(max - min + 1))
  med_value = values(i)

  ' Swap the dividing item to the front of the list.
  values(i) = values(min)

  ' Separate the list into sublists.
  lo = min
  hi = max
  Do
    ' Look down from hi for a value < med_value.
    Do While values(hi) >= med_value
      hi = hi - 1
      If hi <= lo Then Exit Do
    Loop

    If hi <= lo Then
      ' The list is separated.
      values(lo) = med_value
      Exit Do
    End If

    ' Swap the lo and hi values.
    values(lo) = values(hi)

    ' Look up from lo for a value >= med_value.
    lo = lo + 1
    Do While values(lo) < med_value
      lo = lo + 1
      If lo >= hi Then Exit Do
    Loop

    If lo >= hi Then
      ' The list is separated.
      lo = hi
      values(hi) = med_value
      Exit Do
    End If

    ' Swap the lo and hi values.
    values(hi) = values(lo)
  Loop ' Loop until the list is separated.

  ' Recursively sort the sublists.
  Quicksort values, min, lo - 1
  Quicksort values, lo + 1, max

End Sub
 
Upvote 0
Try this :
VBA Code:
Public Sub CreateRectangles()
  Dim c, rng as Range, sht As Worksheet, sRow, cRow, sCol, cCol As Double, cht As Chart, TmpRng() As String, nRow As Boolean

  Set sht = Sheets("KarolisZ7")  ' This should be the name of your sheet with the measurements...
  Set rng = sht.Range("L16:O16, L11:O11, L26:U26, L21:U21, L31:U31") ' These are the ranges you provided, and do not need to be in order...

  Set cht = Charts.Add
  TmpRng = Split(rng.Address, ",")
  Call Quicksort(TmpRng, LBound(TmpRng), UBound(TmpRng))
  Set rng = sht.Range(Join(TmpRng, ", "))
  sRow = -1
  cRow = 0
  sCol = 0
  cCol = 0

  For Each c In rng.Cells
    If cRow <> c.Row Then
      sRow = sRow + 1
      cRow = c.Row
      sCol = cCol
    End If
    With cht.Shapes.AddShape( _
      msoShapeRectangle, _
      sCol, _
      Cm2Point(2 * sRow), _
      Cm2Point(c.Value / 10), _
      Cm2Point(2))
        .Fill.Transparency = 0
        .Fill.ForeColor.RGB = RGB(255, 225, 255)
        .Line.Weight = 3
        .Line.ForeColor.RGB = RGB(112, 48, 160)
        .Name = "Cell:" & c.Address & "; Length = " & c.Value
    End With
    sCol = sCol + Cm2Point(c.Value / 10)
  Next c
  Set sht = Nothing
  Set rng = Nothing
End Sub
Public Function Cm2Point(cm As Double) As Double
  Cm2Point = CSng(cm * 28.3145)
End Function

Public Sub Quicksort(values As Variant, min As Long, max As Long)

  Dim med_value As String
  Dim hi As Long
  Dim lo As Long
  Dim i As Long

  ' If the list has only 1 item, it's sorted.
  If min >= max Then Exit Sub

  ' Pick a dividing item randomly.
  i = min + Int(Rnd(max - min + 1))
  med_value = values(i)

  ' Swap the dividing item to the front of the list.
  values(i) = values(min)

  ' Separate the list into sublists.
  lo = min
  hi = max
  Do
    ' Look down from hi for a value < med_value.
    Do While values(hi) >= med_value
      hi = hi - 1
      If hi <= lo Then Exit Do
    Loop

    If hi <= lo Then
      ' The list is separated.
      values(lo) = med_value
      Exit Do
    End If

    ' Swap the lo and hi values.
    values(lo) = values(hi)

    ' Look up from lo for a value >= med_value.
    lo = lo + 1
    Do While values(lo) < med_value
      lo = lo + 1
      If lo >= hi Then Exit Do
    Loop

    If lo >= hi Then
      ' The list is separated.
      lo = hi
      values(hi) = med_value
      Exit Do
    End If

    ' Swap the lo and hi values.
    values(hi) = values(lo)
  Loop ' Loop until the list is separated.

  ' Recursively sort the sublists.
  Quicksort values, min, lo - 1
  Quicksort values, lo + 1, max

End Sub

First of, thank you for your effort! Now what is happening is I am getting type mismatch error (13) and the debugger shows the problem is here:
With cht.Shapes.AddShape( _
msoShapeRectangle, _
sCol, _
Cm2Point(2 * sRow), _
Cm2Point(c.Value / 10), _
Cm2Point(2))

I am guessing its due to some of the cells in my given ranges having no values in them. Is there a way to program it so that it would ignore cells in the given range which have no values in them and draw only according to the ones which have?

Also, is there a way to program it so that it would put a text in the rectangle (in this case, name of the product) taken out of another cell which is one row lower and represents the width of the product in the upper row cell?
For example, lets say cell L11 has 17,0 cm value in it, and cell L12 has its name "Product 1", it would then put that name as a text in that rectangle.
 
Upvote 0
I believe it is due to them having string or non Numeric values... Most likely NULL string ""

First of, thank you for your effort! Now what is happening is I am getting type mismatch error (13) and the debugger shows the problem is here:
With cht.Shapes.AddShape( _
msoShapeRectangle, _
sCol, _
Cm2Point(2 * sRow), _
Cm2Point(c.Value / 10), _
Cm2Point(2))

I am guessing its due to some of the cells in my given ranges having no values in them. Is there a way to program it so that it would ignore cells in the given range which have no values in them and draw only according to the ones which have?

Also, is there a way to program it so that it would put a text in the rectangle (in this case, name of the product) taken out of another cell which is one row lower and represents the width of the product in the upper row cell?
For example, lets say cell L11 has 17,0 cm value in it, and cell L12 has its name "Product 1", it would then put that name as a text in that rectangle.

Change to this:
VBA Code:
Public Sub CreateRectangles()
  Dim c, rng As Range, sht As Worksheet, sRow, cRow, sCol, cCol, cVal As Double, cht As Chart, TmpRng() As String
 
  Set sht = Sheets("KarolisZ7")  ' This should be the name of your sheet with the measurements...
  Set rng = sht.Range("L16:O16, L11:O11, L26:U26, L21:U21, L31:U31") ' These are the ranges you provided, and do not need to be in order...
 
  Set cht = Charts.Add
  TmpRng = Split(rng.Address, ",")
  Call Quicksort(TmpRng, LBound(TmpRng), UBound(TmpRng))
  Set rng = sht.Range(Join(TmpRng, ", "))
  sRow = -1
  cRow = 0
  sCol = 0
  cCol = 0
 
  For Each c In rng.Cells
    If IsNumeric(c.Value) Then
      cVal = c.Value
    Else
      cVal = 0
    End If
    If cRow <> c.Row Then
      sRow = sRow + 1
      cRow = c.Row
      sCol = cCol
    End If
    With cht.Shapes.AddShape( _
      msoShapeRectangle, _
      sCol, _
      Cm2Point(2 * sRow), _
      Cm2Point(cVal / 10), _
      Cm2Point(2))
        .Fill.Transparency = 0
        .Fill.ForeColor.RGB = RGB(255, 225, 255)
        .Line.Weight = 3
        .Line.ForeColor.RGB = RGB(112, 48, 160)
        .Name = "Cell:" & c.Address & "; Length = " & c.Value
    End With
    sCol = sCol + Cm2Point(cVal / 10)
  Next c
  Set sht = Nothing
  Set rng = Nothing
End Sub

Public Function Cm2Point(cm As Double) As Double
  Cm2Point = CSng(cm * 28.3145)
End Function

Public Sub Quicksort(values As Variant, min As Long, max As Long)

  Dim med_value As String
  Dim hi As Long
  Dim lo As Long
  Dim i As Long

  ' If the list has only 1 item, it's sorted.
  If min >= max Then Exit Sub

  ' Pick a dividing item randomly.
  i = min + Int(Rnd(max - min + 1))
  med_value = values(i)

  ' Swap the dividing item to the front of the list.
  values(i) = values(min)

  ' Separate the list into sublists.
  lo = min
  hi = max
  Do
    ' Look down from hi for a value < med_value.
    Do While values(hi) >= med_value
      hi = hi - 1
      If hi <= lo Then Exit Do
    Loop

    If hi <= lo Then
      ' The list is separated.
      values(lo) = med_value
      Exit Do
    End If

    ' Swap the lo and hi values.
    values(lo) = values(hi)

    ' Look up from lo for a value >= med_value.
    lo = lo + 1
    Do While values(lo) < med_value
      lo = lo + 1
      If lo >= hi Then Exit Do
    Loop

    If lo >= hi Then
      ' The list is separated.
      lo = hi
      values(hi) = med_value
      Exit Do
    End If

    ' Swap the lo and hi values.
    values(hi) = values(lo)
  Loop ' Loop until the list is separated.

  ' Recursively sort the sublists.
  Quicksort values, min, lo - 1
  Quicksort values, lo + 1, max

End Sub
 
Last edited:
Upvote 0
Did this help / work correctly?
 
Upvote 0
I believe it is due to them having string or non Numeric values... Most likely NULL string ""


Change to this:
VBA Code:
Public Sub CreateRectangles()
  Dim c, rng As Range, sht As Worksheet, sRow, cRow, sCol, cCol, cVal As Double, cht As Chart, TmpRng() As String

  Set sht = Sheets("KarolisZ7")  ' This should be the name of your sheet with the measurements...
  Set rng = sht.Range("L16:O16, L11:O11, L26:U26, L21:U21, L31:U31") ' These are the ranges you provided, and do not need to be in order...

  Set cht = Charts.Add
  TmpRng = Split(rng.Address, ",")
  Call Quicksort(TmpRng, LBound(TmpRng), UBound(TmpRng))
  Set rng = sht.Range(Join(TmpRng, ", "))
  sRow = -1
  cRow = 0
  sCol = 0
  cCol = 0

  For Each c In rng.Cells
    If IsNumeric(c.Value) Then
      cVal = c.Value
    Else
      cVal = 0
    End If
    If cRow <> c.Row Then
      sRow = sRow + 1
      cRow = c.Row
      sCol = cCol
    End If
    With cht.Shapes.AddShape( _
      msoShapeRectangle, _
      sCol, _
      Cm2Point(2 * sRow), _
      Cm2Point(cVal / 10), _
      Cm2Point(2))
        .Fill.Transparency = 0
        .Fill.ForeColor.RGB = RGB(255, 225, 255)
        .Line.Weight = 3
        .Line.ForeColor.RGB = RGB(112, 48, 160)
        .Name = "Cell:" & c.Address & "; Length = " & c.Value
    End With
    sCol = sCol + Cm2Point(cVal / 10)
  Next c
  Set sht = Nothing
  Set rng = Nothing
End Sub

Public Function Cm2Point(cm As Double) As Double
  Cm2Point = CSng(cm * 28.3145)
End Function

Public Sub Quicksort(values As Variant, min As Long, max As Long)

  Dim med_value As String
  Dim hi As Long
  Dim lo As Long
  Dim i As Long

  ' If the list has only 1 item, it's sorted.
  If min >= max Then Exit Sub

  ' Pick a dividing item randomly.
  i = min + Int(Rnd(max - min + 1))
  med_value = values(i)

  ' Swap the dividing item to the front of the list.
  values(i) = values(min)

  ' Separate the list into sublists.
  lo = min
  hi = max
  Do
    ' Look down from hi for a value < med_value.
    Do While values(hi) >= med_value
      hi = hi - 1
      If hi <= lo Then Exit Do
    Loop

    If hi <= lo Then
      ' The list is separated.
      values(lo) = med_value
      Exit Do
    End If

    ' Swap the lo and hi values.
    values(lo) = values(hi)

    ' Look up from lo for a value >= med_value.
    lo = lo + 1
    Do While values(lo) < med_value
      lo = lo + 1
      If lo >= hi Then Exit Do
    Loop

    If lo >= hi Then
      ' The list is separated.
      lo = hi
      values(hi) = med_value
      Exit Do
    End If

    ' Swap the lo and hi values.
    values(hi) = values(lo)
  Loop ' Loop until the list is separated.

  ' Recursively sort the sublists.
  Quicksort values, min, lo - 1
  Quicksort values, lo + 1, max

End Sub

Thank you CSmith! This seems to work very well. The only detail I would like to change is for the code to generate these rectangles in the same working sheet at specific place (with x, y coordinates). It would be more convenient for me as the current code generates additional sheet and it also draws a graphical chart next to these rectangles which is not needed. Thank you once again.
 
Upvote 0
You would need to simply list where you want them to appear. Should they be translucent or opaque?
 
Upvote 0
You would need to simply list where you want them to appear. Should they be translucent or opaque?

Lets say I need them to appear on coordinates X: 2000 , Y:200 . Also, it would be great if the shapes would be opaque.
 
Upvote 0
VBA Code:
Public Sub CreateRectangles()
  Const bY = 200, bX = 2000
  Dim c, rng As Range, sht As Worksheet, sRow, cRow, sCol, cCol, cVal As Double, TmpRng() As String

  Set sht = Sheets("KarolisZ7")  ' This should be the name of your sheet with the measurements...
  Set rng = sht.Range("L16:O16, L11:O11, L26:U26, L21:U21, L31:U31") ' These are the ranges you provided, and do not need to be in order...

    TmpRng = Split(rng.Address, ",")
  Call Quicksort(TmpRng, LBound(TmpRng), UBound(TmpRng))
  Set rng = sht.Range(Join(TmpRng, ", "))
  sRow = -1
  cRow = 0
  sCol = 0
  cCol = 0

  For Each c In rng.Cells
    If IsNumeric(c.Value) Then
      cVal = c.Value
    Else
      cVal = 0
    End If
    If cRow <> c.Row Then
      sRow = sRow + 1
      cRow = c.Row
      sCol = cCol
    End If
    With sht.Shapes.AddShape( _
      msoShapeRectangle, _
      sCol + bX, _
      Cm2Point(2 * sRow) + bY, _
      Cm2Point(cVal / 10), _
      Cm2Point(2))
        .Fill.Transparency = 0
        .Fill.ForeColor.RGB = RGB(255, 225, 255)
        .Line.Weight = 3
        .Line.ForeColor.RGB = RGB(112, 48, 160)
        .Name = "Cell:" & c.Address & "; Length = " & c.Value
    End With
    sCol = sCol + Cm2Point(cVal / 10)
  Next c
  Set sht = Nothing
  Set rng = Nothing
End Sub

Public Function Cm2Point(cm As Double) As Double
  Cm2Point = CSng(cm * 28.3145)
End Function

Public Sub Quicksort(values As Variant, min As Long, max As Long)

  Dim med_value As String
  Dim hi As Long
  Dim lo As Long
  Dim i As Long

  ' If the list has only 1 item, it's sorted.
  If min >= max Then Exit Sub

  ' Pick a dividing item randomly.
  i = min + Int(Rnd(max - min + 1))
  med_value = values(i)

  ' Swap the dividing item to the front of the list.
  values(i) = values(min)

  ' Separate the list into sublists.
  lo = min
  hi = max
  Do
    ' Look down from hi for a value < med_value.
    Do While values(hi) >= med_value
      hi = hi - 1
      If hi <= lo Then Exit Do
    Loop

    If hi <= lo Then
      ' The list is separated.
      values(lo) = med_value
      Exit Do
    End If

    ' Swap the lo and hi values.
    values(lo) = values(hi)

    ' Look up from lo for a value >= med_value.
    lo = lo + 1
    Do While values(lo) < med_value
      lo = lo + 1
      If lo >= hi Then Exit Do
    Loop

    If lo >= hi Then
      ' The list is separated.
      lo = hi
      values(hi) = med_value
      Exit Do
    End If

    ' Swap the lo and hi values.
    values(hi) = values(lo)
  Loop ' Loop until the list is separated.

  ' Recursively sort the sublists.
  Quicksort values, min, lo - 1
  Quicksort values, lo + 1, max

End Sub
 
Upvote 0
I didn't like the above as all shapes are separate and not really grouped in any way, so I rewrote to this:

VBA Code:
Public Sub CreateRectangles()
  Const bY = 200, bX = 2000
  Dim c, r, rng As Range, sht As Worksheet, sRow, cRow, sCol, cCol, cVal, maxWidth As Double, cht As Chart, tmpStr, tmpRng() As String

  Set sht = Sheets("KarolisZ7")  ' This should be the name of your sheet with the measurements...
  Set rng = sht.Range("L16:O16, L11:O11, L26:U26, L21:U21, L31:U31") ' These are the ranges you provided, and do not need to be in order...
  Set cht = sht.Shapes.AddChart.Chart
  tmpStr = "Max(Sum(" & Join(Split(rng.Address, ","), "), Sum(") & "))"
  maxWidth = Application.Evaluate(tmpStr) / 10
 
  cht.Shapes.SelectAll
  Selection.Delete
 
  cht.ChartArea.Left = bX
  cht.ChartArea.Top = bY
  cht.ChartArea.Height = Cm2Point(2 * RowsCount(rng)) + 3
  cht.ChartArea.Width = Cm2Point(maxWidth) + 2
 
  tmpRng = Split(rng.Address, ",")
  Call Quicksort(tmpRng, LBound(tmpRng), UBound(tmpRng))
 
  Set rng = sht.Range(Join(tmpRng, ", "))
  sRow = 0
  cRow = 0
  sCol = 0
  cCol = 0

  For Each r In rng.Rows
    sCol = 0
    For Each c In r.Cells
      If IsNumeric(c.Value) Then
       cVal = c.Value
      Else
        cVal = 0
      End If
      With cht.Shapes.AddShape( _
        msoShapeRectangle, _
        sCol, _
        Cm2Point(2 * sRow), _
        Cm2Point(cVal / 10), _
        Cm2Point(2))
          .Fill.Transparency = 0
          .Fill.ForeColor.RGB = RGB(238, 238, 225)
          .Line.Weight = 3
          .Line.ForeColor.RGB = RGB(112, 48, 160)
          .Name = "Cell:" & c.Address & "; Length = " & c.Value
      End With
      sCol = sCol + Cm2Point(cVal / 10)
    Next c
    sRow = sRow + 1
  Next r
 
  Set cht = Nothing
  Set sht = Nothing
  Set rng = Nothing
End Sub

Public Function Cm2Point(cm As Double) As Double
  Cm2Point = CSng(cm * 28.3145)
End Function

Public Sub Quicksort(values As Variant, min As Long, max As Long)

  Dim med_value As String
  Dim hi As Long
  Dim lo As Long
  Dim i As Long

  ' If the list has only 1 item, it's sorted.
  If min >= max Then Exit Sub

  ' Pick a dividing item randomly.
  i = min + Int(Rnd(max - min + 1))
  med_value = values(i)

  ' Swap the dividing item to the front of the list.
  values(i) = values(min)

  ' Separate the list into sublists.
  lo = min
  hi = max
  Do
    ' Look down from hi for a value < med_value.
    Do While values(hi) >= med_value
      hi = hi - 1
      If hi <= lo Then Exit Do
    Loop

    If hi <= lo Then
      ' The list is separated.
      values(lo) = med_value
      Exit Do
    End If

    ' Swap the lo and hi values.
    values(lo) = values(hi)

    ' Look up from lo for a value >= med_value.
    lo = lo + 1
    Do While values(lo) < med_value
      lo = lo + 1
      If lo >= hi Then Exit Do
    Loop

    If lo >= hi Then
      ' The list is separated.
      lo = hi
      values(hi) = med_value
      Exit Do
    End If

    ' Swap the lo and hi values.
    values(hi) = values(lo)
  Loop ' Loop until the list is separated.

  ' Recursively sort the sublists.
  Quicksort values, min, lo - 1
  Quicksort values, lo + 1, max

End Sub

Public Function RowsCount(rng As Range) As Long
  Dim tmp As Range, tmpRng() As String, countRows As Long
  RowsCount = 0
  tmpRng = Split(rng.Address, ",")
  For Each tmp In Range(Join(tmpRng, ", ")).Rows
    RowsCount = RowsCount + 1
  Next
End Function
 
Upvote 0

Forum statistics

Threads
1,221,469
Messages
6,160,028
Members
451,611
Latest member
PattiButche

We've detected that you are using an adblocker.

We have a great community of people providing Excel help here, but the hosting costs are enormous. You can help keep this site running by allowing ads on MrExcel.com.
Allow Ads at MrExcel

Which adblocker are you using?

Disable AdBlock

Follow these easy steps to disable AdBlock

1)Click on the icon in the browser’s toolbar.
2)Click on the icon in the browser’s toolbar.
2)Click on the "Pause on this site" option.
Go back

Disable AdBlock Plus

Follow these easy steps to disable AdBlock Plus

1)Click on the icon in the browser’s toolbar.
2)Click on the toggle to disable it for "mrexcel.com".
Go back

Disable uBlock Origin

Follow these easy steps to disable uBlock Origin

1)Click on the icon in the browser’s toolbar.
2)Click on the "Power" button.
3)Click on the "Refresh" button.
Go back

Disable uBlock

Follow these easy steps to disable uBlock

1)Click on the icon in the browser’s toolbar.
2)Click on the "Power" button.
3)Click on the "Refresh" button.
Go back
Back
Top