TryingBest
New Member
- Joined
- Aug 2, 2022
- Messages
- 30
- Office Version
- 2016
- Platform
- Windows
Hi,
I am new to this VBA and don't really do code. But, I would appreciate, it if someone can help with automating my report Data. This way can save a lot of my time.
I did try all the solutions available over the Internet, but none seems to work.
Here is what I want,
1. Select all the data-filled rows in column A, before the blank cell/row.
a. If possible apply filter to this, so all the columns get sorted according to this. (From Column A to S, in actual raw data).
2. Then Inset 4 columns to the right of Column B (Duration) - that formula should be hardcoded - as this calculates with downtime and uptime of any given entity.
3. Unique Names from Column A to be sorted and pasted in Column I (for instance).
4. Column J should calculate the uptime for its entity name in column I - in percentage (%), i.e. 100%-(SUM(D2,D13)) - In this case for A.
I guess, this can be done via SUMIF.
I have pasted be a table below (for reference) and a snapshot as well.
Looking forward to some positive replies and solutions, please.
TIA.
I am new to this VBA and don't really do code. But, I would appreciate, it if someone can help with automating my report Data. This way can save a lot of my time.
I did try all the solutions available over the Internet, but none seems to work.
Here is what I want,
1. Select all the data-filled rows in column A, before the blank cell/row.
a. If possible apply filter to this, so all the columns get sorted according to this. (From Column A to S, in actual raw data).
2. Then Inset 4 columns to the right of Column B (Duration) - that formula should be hardcoded - as this calculates with downtime and uptime of any given entity.
3. Unique Names from Column A to be sorted and pasted in Column I (for instance).
4. Column J should calculate the uptime for its entity name in column I - in percentage (%), i.e. 100%-(SUM(D2,D13)) - In this case for A.
I guess, this can be done via SUMIF.
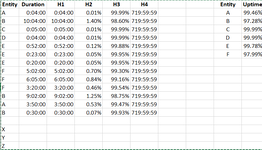
I have pasted be a table below (for reference) and a snapshot as well.
Looking forward to some positive replies and solutions, please.
TIA.
| Entity | Duration | H1 | H2 | H3 | H4 | Entity | Uptime | ||
| A | 0:04:00 | 0:04:00 | 0.01% | 99.99% | 719:59:59 | A | 99.46% | ||
| B | 10:04:00 | 10:04:00 | 1.40% | 98.60% | 719:59:59 | B | 97.28% | ||
| C | 0:05:00 | 0:05:00 | 0.01% | 99.99% | 719:59:59 | C | 99.99% | ||
| D | 0:04:00 | 0:04:00 | 0.01% | 99.99% | 719:59:59 | D | 99.99% | ||
| E | 0:52:00 | 0:52:00 | 0.12% | 99.88% | 719:59:59 | E | 99.78% | ||
| E | 0:23:00 | 0:23:00 | 0.05% | 99.95% | 719:59:59 | F | 97.99% | ||
| E | 0:20:00 | 0:20:00 | 0.05% | 99.95% | 719:59:59 | ||||
| F | 5:02:00 | 5:02:00 | 0.70% | 99.30% | 719:59:59 | ||||
| F | 6:05:00 | 6:05:00 | 0.84% | 99.16% | 719:59:59 | ||||
| F | 3:20:00 | 3:20:00 | 0.46% | 99.54% | 719:59:59 | ||||
| B | 9:02:00 | 9:02:00 | 1.25% | 98.75% | 719:59:59 | ||||
| A | 3:50:00 | 3:50:00 | 0.53% | 99.47% | 719:59:59 | ||||
| B | 0:30:00 | 0:30:00 | 0.07% | 99.93% | 719:59:59 | ||||
| X | |||||||||
| Y | |||||||||
| Z |