Hi
I thought this would be really simple using PowerQuery but it isn't.
I don't have XL2BB plugin enabled on this PC and couldn't even get it to run last time I checked.
I have a file from a car scanning app which is live data of one of my cars.
Someone on Fabric community looked at it for me and was able to produce a chart but the quality is really poor. I need to be able to zoom in and see thin lines and data discrepancies and PowerBI free edition only seems to produce fancy visuals that aren't really that much use for what I want to look at.
Here is the file on OneDrive:-
Car Data.xlsx
It is set to edit so anyone can do what they want with it.
It cannot really be difficult to create such a chart based on time elapsed, PID's and their respective values but it's too much for my seemingly simple mind to comprehend.
Here is a link to the graph someone created on the Fabric Community which is accurate and what I am trying to achieve but in a BETTER format that allows you to zoom in and out, scroll quickly and analyse where there may be an issue.
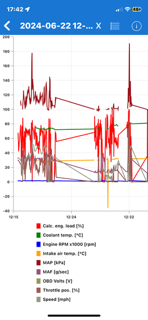
Here is a photo of how the data appears on the app it has come from (I've flipped the orientation so the legend intrudes but that's fine for the purposes of showing you:-
IT WON'T UPLOAD!
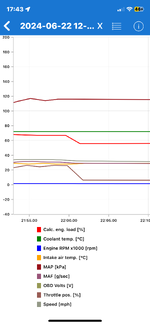
The second photo is where I have selected less PID's to show the information I want to filter in portrait:-
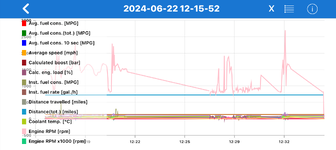
The third photo which is the zoomed in one shows one area of interest and a good level of detail although it would be nice to see the values which I need to see.
Look it's only a personal play-around so if it's too difficult to explain what I'll need to do then don't waste your time and I'll knock the idea on the head. It's just that my proper car diagnostics scanner is broken at the moment and I'm not sure I'll be looking replace it so am looking for cheaper solutions and trying to think of a way around it.
As I can record the data for each journey, it needs to be really simple for me to understand how to collate and present the information on any dataset because I don't want to spend HOURS and HOURS stuck in Excel scratching my ageing and stupid head!
Thanks in advance.
I thought this would be really simple using PowerQuery but it isn't.
I don't have XL2BB plugin enabled on this PC and couldn't even get it to run last time I checked.
I have a file from a car scanning app which is live data of one of my cars.
Someone on Fabric community looked at it for me and was able to produce a chart but the quality is really poor. I need to be able to zoom in and see thin lines and data discrepancies and PowerBI free edition only seems to produce fancy visuals that aren't really that much use for what I want to look at.
Here is the file on OneDrive:-
Car Data.xlsx
It is set to edit so anyone can do what they want with it.
It cannot really be difficult to create such a chart based on time elapsed, PID's and their respective values but it's too much for my seemingly simple mind to comprehend.
Here is a link to the graph someone created on the Fabric Community which is accurate and what I am trying to achieve but in a BETTER format that allows you to zoom in and out, scroll quickly and analyse where there may be an issue.
Here is a photo of how the data appears on the app it has come from (I've flipped the orientation so the legend intrudes but that's fine for the purposes of showing you:-
IT WON'T UPLOAD!
The second photo is where I have selected less PID's to show the information I want to filter in portrait:-
The third photo which is the zoomed in one shows one area of interest and a good level of detail although it would be nice to see the values which I need to see.
Look it's only a personal play-around so if it's too difficult to explain what I'll need to do then don't waste your time and I'll knock the idea on the head. It's just that my proper car diagnostics scanner is broken at the moment and I'm not sure I'll be looking replace it so am looking for cheaper solutions and trying to think of a way around it.
As I can record the data for each journey, it needs to be really simple for me to understand how to collate and present the information on any dataset because I don't want to spend HOURS and HOURS stuck in Excel scratching my ageing and stupid head!
Thanks in advance.