anthonyenglish
New Member
- Joined
- Jan 17, 2005
- Messages
- 21
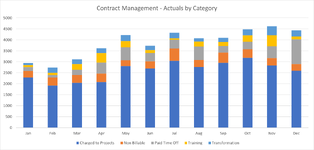
I have data. It's currently in the format of Date, Category, value. There are 5 categories and I want to produce a stacked bar graph and a second stacked 100% graph - showing the percentage split. That bit is easy. However I have 2 categories of the 5 which I have been asked to total and plot as a line to show on the 2 graphs.....Essentially its time booking and 2 categories are classed as Productive time. I can do this in a fairly manual way when messing about with the data. Is there a way of doing it in a clever way using powerpivot. Ideally I'd like to be able to put slicers on the output so that they can drill down etc