Hi,
I'm very new to excel and would appreciate help .")
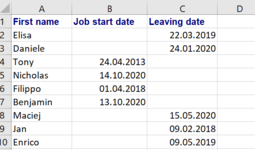
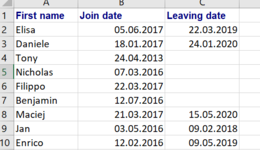
I have a list of 48 employees. some current, some left.
The info i have on each is start date and leaving date. (screenshot attached).
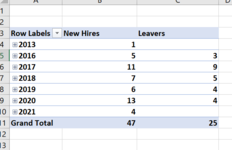
i would like a chart that shows how many total active employees there are and how many new starters there are in each quarter since 2017.
I am COMPLETELY lost and have been trying all day with date tables, measures... I just cant get anywhere close.
I would be so so grateful for any help.
I'm very new to excel and would appreciate help .
I have a list of 48 employees. some current, some left.
The info i have on each is start date and leaving date. (screenshot attached).
i would like a chart that shows how many total active employees there are and how many new starters there are in each quarter since 2017.
I am COMPLETELY lost and have been trying all day with date tables, measures... I just cant get anywhere close.
I would be so so grateful for any help.