L
Legacy 519704
Guest
Hi
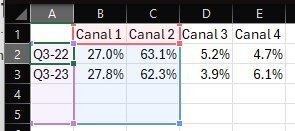
I have the routine where chart is created in a ppt template and is created OK but should use other two series(Column D and E, also ignore row 4 and 5) please check the attached image, and i dont know how to tell the chart that
Already tried
But non of that worked for me
the code of the creation is this one
Im not sure what to do in order to solve this issue, thanks in advance
I have the routine where chart is created in a ppt template and is created OK but should use other two series(Column D and E, also ignore row 4 and 5) please check the attached image, and i dont know how to tell the chart that
Already tried
VBA Code:
pptChartWorksheet.Range("A1:E3").Columns.AutoFit
pptChartWorksheet.Range("A1:E3").CurrentRegion.EntireColumn.AutoFit
pptChartWorksheet.Columns("A:E").AutoFit
But non of that worked for me
the code of the creation is this one
VBA Code:
Sub CreateChart(slide As Object, seriesRange As Range, posX As Single, posY As Single, chartWidth As Single, chartHeight As Single)
    Dim pptChart As Object
    Dim pptChartData As Object
    Dim pptChartWorkbook As Object
    Dim pptChartWorksheet As Object
    Dim r As Integer, c As Integer

    ' Create the chart
    Set pptChart = slide.Shapes.AddChart2(297, xlColumnStacked100, posX, posY, chartWidth, chartHeight).Chart
    ' Access the embedded Excel data sheet in the PowerPoint chart
    On Error Resume Next
    Set pptChartData = pptChart.ChartData
    ' Attempt to activate the chart data
    pptChartData.Activate
    ' Get the embedded Excel workbook and worksheet
    Set pptChartWorkbook = pptChartData.Workbook
    Set pptChartWorksheet = pptChartWorkbook.Worksheets(1)

    ' Clear existing data (optional)
    pptChartWorksheet.Cells.Clear

    ' Ensure the embedded workbook is visible and active
    pptChartWorkbook.Application.Visible = True

    ' Write data from the Excel range directly to the embedded chart Excel sheet starting from A1
    For r = 1 To seriesRange.Rows.Count
        For c = 1 To seriesRange.Columns.Count
            If Not IsEmpty(seriesRange.Cells(r, c)) Then
                ' Paste rows as columns and columns as rows
                pptChartWorksheet.Cells(c, r).Value = seriesRange.Cells(r, c).Value
            End If
        Next c
    Next r

    ' Format the cells to display as percentage
    pptChartWorksheet.Range("B2:E3").NumberFormat = "0.0%"

    ' Clear the clipboard and cut/copy mode
    Application.CutCopyMode = False

    ' Autofit the specific range where data is expected
    pptChartWorksheet.Range("A1:E3").Columns.AutoFit

    ' Format the chart
    With pptChart
        .HasTitle = True
        .ChartTitle.Text = "Chart Title"
        .ChartTitle.Font.Name = "Arial"
        .ChartTitle.Font.Size = 14
        .ChartTitle.Font.Bold = True
        .ChartTitle.Font.Color = RGB(0, 0, 0)
        ' Set series colors
        Dim i As Integer
        Dim colors As Variant
        colors = Array(RGB(174, 174, 159), RGB(0, 176, 240), RGB(0, 182, 0), RGB(254, 219, 0)) ' Colors for series

        For i = 1 To .SeriesCollection.Count
            With .SeriesCollection(i)
                .Format.Fill.ForeColor.RGB = colors((i - 1) Mod UBound(colors) + 1) ' Assign color to series
                .InvertIfNegative = True ' Set InvertIfNegative
                .HasDataLabels = False ' Hide data labels
            End With
        Next i

        ' Additional formatting options
        With .ChartGroups(1)
            .Overlap = 100
            .GapWidth = 150
        End With

        ' Hide the legend
        .HasLegend = False
    End With

    ' Close the embedded Excel workbook
    pptChartWorkbook.Close False

    ' Clean up to avoid memory leaks or object disconnection issues
    Set pptChartWorkbook = Nothing
    Set pptChartWorksheet = Nothing
    Set pptChartData = Nothing
    Set pptChart = Nothing
End Sub
Im not sure what to do in order to solve this issue, thanks in advance