I need help creating a 'verification' monthly summary table and I will try to explain what I want using an example.
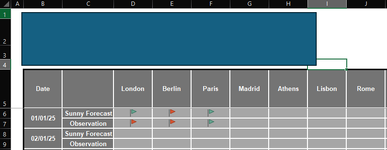
I have a spreadsheet with dates in column B starting from row 6 (1st Jan 2025 - 31st Dec 2025), these dates are merged cells over two rows, so rather than 365 rows there are 730 rows.
I have cities in Europe along row 5 columns D to J.
For each date I have 'Sunny Forecast' and 'Observation', what someone will do is forecast whether it will be sunny in those cities on that date and either put a 0 for yes (green flag) or a 1 for no (red flag).
The next day they will verify whether it was sunny or not, by again putting a 0 or 1.
If both are 0 for that date then it is a 'hit', if both are 1 for that date then it is also a 'hit', if the forecast is a 0 but the observation is a 1 then it is a 'miss', if the forecast is a 1 but the observation is a 0 then it is a 'false alarm'. This probably sounds strange but it is just an example!
Essentially what I want to be able to do is in a blank table on another sheet, select a month from a drop down box above the table, and then for the table to auto-populate whether for each date and for each city it was a hit, miss or false alarm, by automatically entering either a H, M or FA in the cell. Again I'd like cities along the top and dates along the side.
I suppose there needs to be an IF formula (with some ISNUMBER statements too) checking whether cells are equal, more than or less than 0 or 1? Or is there a better way to do it, I've got no idea, so any help would be very much appreciated.
Hopefully that makes sense, I've attached a screenshot of the top of the spreadsheet for reference.