Red over White
Board Regular
- Joined
- Jul 16, 2011
- Messages
- 134
- Office Version
- 365
- Platform
- MacOS
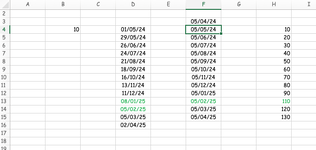
I am trying to come up with a formula whereby only when you get to the date in column F4 onwards does the figure in column H on the same row appears.
The figures in column H is a cumulative total of B4 based on the number of times the dates in Column D is/are either greater than a date in column F AND less than or equal to the date in the row below. The dates in column D are simply a recurring 28 days after the last one. In most cases there is just one 'event' in each period, but there will always one occasion when you get two events in a period and this one is highlighted in green.
Thanks in advance