Fixed curve on scatterplot or line graph

Liliquestionsxlxs

New Member
Joined
Mar 2, 2022
Messages
17
Office Version
  1. 2021
Platform
  1. Windows
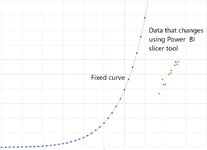
I have this Excel graph I want the fixed curve to stay put in a Power BI scatterplot or line graph. I know how to graph the data and I use the slicer tool to change the data, but I want to have this curve fixed as the control limit of the data. I also want the curve to stay fixed even when I select another set of data using the slicer tool.
 

Attachments

  • Capturepbiquestion.jpg
    Capturepbiquestion.jpg
    55.2 KB · Views: 9

Excel Facts

Excel Joke
Why can't spreadsheets drive cars? They crash too often!

Forum statistics

Threads
1,226,730
Messages
6,192,711
Members
453,748
Latest member
akhtarf3

We've detected that you are using an adblocker.

We have a great community of people providing Excel help here, but the hosting costs are enormous. You can help keep this site running by allowing ads on MrExcel.com.
Allow Ads at MrExcel

Which adblocker are you using?

Disable AdBlock

Follow these easy steps to disable AdBlock

1)Click on the icon in the browser’s toolbar.
2)Click on the icon in the browser’s toolbar.
2)Click on the "Pause on this site" option.
Go back

Disable AdBlock Plus

Follow these easy steps to disable AdBlock Plus

1)Click on the icon in the browser’s toolbar.
2)Click on the toggle to disable it for "mrexcel.com".
Go back

Disable uBlock Origin

Follow these easy steps to disable uBlock Origin

1)Click on the icon in the browser’s toolbar.
2)Click on the "Power" button.
3)Click on the "Refresh" button.
Go back

Disable uBlock

Follow these easy steps to disable uBlock

1)Click on the icon in the browser’s toolbar.
2)Click on the "Power" button.
3)Click on the "Refresh" button.
Go back
Back
Top