Hello everyone
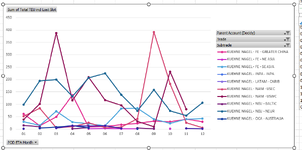
My name is Antoine and I am currently a intern in a shipping company in taiwan. I am not new to excel but I am far from being an expert. I was given a task that consists in creating a customer profile for our 60 biggest customers. The goal of this profile is to be able to show the trends of the customers across the months and the years. For example taking a look at where a certain customer exports the most in a certain month. Now I need help because I am out of ideas when it comes to organizing the data for it to be readable by someone that doesnt have much time or isnt a excel nerd. Attached is an image of a graph that is for the different commodities imported by a client across 2023-2024 and jan to dec. How would you advise me to present the data (Divide it by commodity in a graph or pivot tables. I am out of ideas guys anything is welcome
Thank you for taking the time to read this")
My name is Antoine and I am currently a intern in a shipping company in taiwan. I am not new to excel but I am far from being an expert. I was given a task that consists in creating a customer profile for our 60 biggest customers. The goal of this profile is to be able to show the trends of the customers across the months and the years. For example taking a look at where a certain customer exports the most in a certain month. Now I need help because I am out of ideas when it comes to organizing the data for it to be readable by someone that doesnt have much time or isnt a excel nerd. Attached is an image of a graph that is for the different commodities imported by a client across 2023-2024 and jan to dec. How would you advise me to present the data (Divide it by commodity in a graph or pivot tables. I am out of ideas guys anything is welcome
Thank you for taking the time to read this