rich987652
New Member
- Joined
- May 14, 2002
- Messages
- 29
Hi, I have a problem with a DAX measure I have created that is not giving me the answer that I had expected?
Can anyone advise if they see anything wrong conceptually with the formula below as a measure:
=SUMX('P L',[Actual Revenues]*RELATED(PSpercent_interco[`PS %]))
[Actual Revenues] is a measure that works fine created through a CALCULATE formula
The amount inside the RELATED functions is just looking up a % to multiply the actual revenues by.
Some of the rows on my pivot table are calculating correctly, but some are not but I can't work out why. I have tried creating a calculated column in power pivot using a RELATED formula to generate a column for the %'s but that gives me the same answer too.
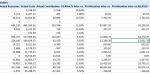
The last column on the attached image is the measure I'm trying to do, and the penultimate column is the one showing the correct calculation - the penultimate column does not generate the correct sub-totals (not shown on the image) which is why I was trying this new measure (where the sub-totals are correctly the sum of the numbers above, but I can't get the measure itself to calculate correctly). You can some rows show the correct figures, but others don't.
Thanks for reading my question.
Can anyone advise if they see anything wrong conceptually with the formula below as a measure:
=SUMX('P L',[Actual Revenues]*RELATED(PSpercent_interco[`PS %]))
[Actual Revenues] is a measure that works fine created through a CALCULATE formula
The amount inside the RELATED functions is just looking up a % to multiply the actual revenues by.
Some of the rows on my pivot table are calculating correctly, but some are not but I can't work out why. I have tried creating a calculated column in power pivot using a RELATED formula to generate a column for the %'s but that gives me the same answer too.
The last column on the attached image is the measure I'm trying to do, and the penultimate column is the one showing the correct calculation - the penultimate column does not generate the correct sub-totals (not shown on the image) which is why I was trying this new measure (where the sub-totals are correctly the sum of the numbers above, but I can't get the measure itself to calculate correctly). You can some rows show the correct figures, but others don't.
Thanks for reading my question.