DAX - incorrect count when applying filters on dashboard

Jon von der Heyden

MrExcel MVP, Moderator
Joined
Apr 6, 2004
Messages
10,912
Office Version
  1. 365
Platform
  1. Windows
Hi

I have a table, key fields being:
  • retailer_name
  • order_ref_id
  • order_date
  • payer_status
I have the following DAX measure:
VBA Code:
Perc Orders By Payer Status by Retailer =
var SelectedOrders = COUNT(conversion_loan_collection_order[order_ref_id])
var SelectedRetailerOrders = CALCULATE(COUNT(conversion_loan_collection_order[order_ref_id]), ALL(conversion_loan_collection_order[payer_status]))
return
SelectedOrders/SelectedRetailerOrders

I have a dashboard that shows the measure result by retailer_name (across rows) and payer_status (across columns).

It appears to work OK with no filters on the dashboard.

Then I have an order_date slicer having selected 01/01/2021 - 30/09/2021 (dd/mm/yyyy)
And I have selected a single retailer in another slicer (lets call this RetailerA)

I can observe the following correct results:

SelectedretailerOrders = 636, of which payer_status:
always late : 4
always pays : 452
escape : 99
never pays : 21
sometimes late: 39
sometimes pays: 21

I have validated these order_ref_id counts by manually applying the retailer_name and order_date filters to the dataset.

The problem is that I also have a slicer on the dashboard for payer_status. If I select only 'never pays', it displays a result of 116, instead of the correct 21.

I can't even figure out a count of 116.

Can anyone suggest what is wrong?
 

Excel Facts

What did Pito Salas invent?
Pito Salas, working for Lotus, popularized what would become to be pivot tables. It was released as Lotus Improv in 1989.
Am I missing something? Your measure is a percentage, not a count, so where are you seeing those numbers?
 
Upvote 0
Sorry, the counts are the results of inspecting the numerator and denominator. I.e. the % is the respective payer_status over the total order count (order_ref_id) for the respective retailers
 
Upvote 0
Which one is showing the 116 - the numerator?

I assume there are more tables in the model?
 
Upvote 0
It's just the one table.

The percentages represent the payer_status over the total orders.

The dashboard is a bit like a pivot table, but with retailers (retailer_name) running down the rows, and a percentage for each payer_status in the columns adjacent to each retailer.

For RetailerA, the "never pay" percentage should be 21/636.

However I also have a slicer for payer_status, so if I choose only "never pay" then the table will only display the percentages for never/pay over total retailer orders (i.e. only display a single column of values adjacent to each retailer). In this case it is returning 116/636. The 116 is baffling me.

The whole thing is confined to a date range, in this instance.

Screenshots below (but I have removed retailer_names for data protection reasons)...

Before applying payer_status slicer:
1636645057532.png


After applying payer_status slicer:
1636645119058.png


The % values in the second exhibit should be consistent with the "never pay" % values in the first exhibit.
 
Upvote 0
Those figures all look weird! Is it only that value in the slicer that has the problem?
 
Upvote 0
Yes all weird, and it only happens when I choose a single item from the payer_status slicer. Other slicers don't stuff it up.
 
Last edited:
Upvote 0
Any chance you can anonymise it and put a pbix file somewhere?
 
Upvote 0
Hi Rory

pbix is here: payer_status.pbix

I've never shared from google in public, so hope that works.

I cannot explain the problem, but @JustynaMK has found a solution for me, that seems to work.

Firstly we now have a disconnected table that is a copy of the main data table. This is used to feed the order_date slicer, and referenced in the measure.

We use the following measure:
Code:
Perc Orders By Payer Status by Retailer =
    var SelRetailer = SELECTEDVALUE(Table1[retailer_name])
    var DateFrom = MIN('Disconnected Table'[order_date])
    var DateTo = MAX('Disconnected Table'[order_date])
    var StatusCount =
        CALCULATE(
            COUNT(Table1[payer_status]),
            FILTER(Table1, Table1[order_date] >= DateFrom && Table1[order_date] <= DateTo)
        )
    var AllStatusCount =
        CALCULATE(
            COUNT('Disconnected Table'[order_ref_id]),
            FILTER('Disconnected Table', 'Disconnected Table'[retailer_name] = SelRetailer)
        )
return
    StatusCount & "/" & AllStatusCount

Table 1: the original data set.
Disconnected Table: the table clone.

I get the expected results, but to be honest we don't understand why the original approach didn't work. So this is working, but I'm still eager to know why the first measure did not work.
 
Last edited:
Upvote 0
I can't replicate your problem. I put the measure back to your original, removed the disconnected table, and all the filtering seems to work properly.
 
Upvote 0

Forum statistics

Threads
1,223,886
Messages
6,175,193
Members
452,616
Latest member
intern444

We've detected that you are using an adblocker.

We have a great community of people providing Excel help here, but the hosting costs are enormous. You can help keep this site running by allowing ads on MrExcel.com.
Allow Ads at MrExcel

Which adblocker are you using?

Disable AdBlock

Follow these easy steps to disable AdBlock

1)Click on the icon in the browser’s toolbar.
2)Click on the icon in the browser’s toolbar.
2)Click on the "Pause on this site" option.
Go back

Disable AdBlock Plus

Follow these easy steps to disable AdBlock Plus

1)Click on the icon in the browser’s toolbar.
2)Click on the toggle to disable it for "mrexcel.com".
Go back

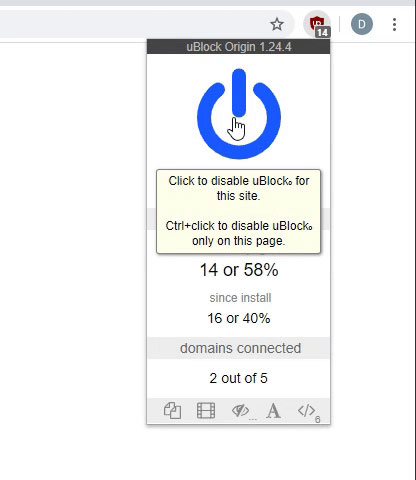
Disable uBlock Origin

Follow these easy steps to disable uBlock Origin

1)Click on the icon in the browser’s toolbar.
2)Click on the "Power" button.
3)Click on the "Refresh" button.
Go back

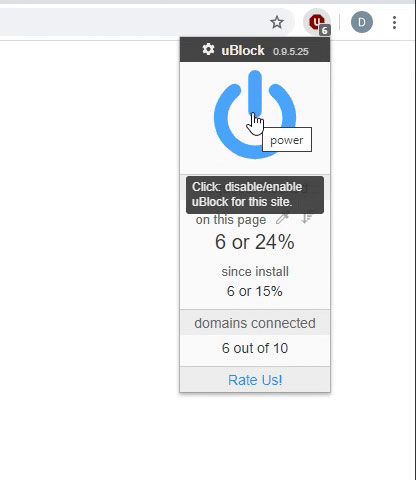
Disable uBlock

Follow these easy steps to disable uBlock

1)Click on the icon in the browser’s toolbar.
2)Click on the "Power" button.
3)Click on the "Refresh" button.
Go back
Back
Top