Redgirl9487
New Member
- Joined
- Jan 18, 2023
- Messages
- 14
- Office Version
- 365
- Platform
- Windows
Hey,
I was wondering if someone could me please?
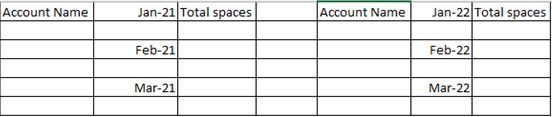
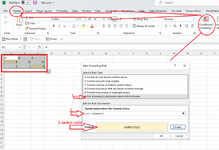
I have to summarise client data per month and compare that data for 2021 Vs 2022 So it reads something like image 1.
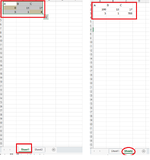
I have a large data dump, but I have split it into tab 1 which is the data for 2021 & tab 2 which is the data for 2022
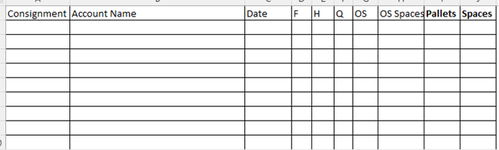
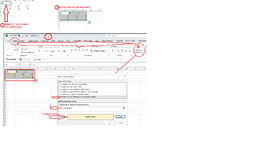
Image 2 is an example of how the data table is.
Please could someone advise the best way to go about this?
I would appreciate anyone's help as I am a new excel user")
Many thanks in advance.
I was wondering if someone could me please?
I have to summarise client data per month and compare that data for 2021 Vs 2022 So it reads something like image 1.
I have a large data dump, but I have split it into tab 1 which is the data for 2021 & tab 2 which is the data for 2022
Image 2 is an example of how the data table is.
Please could someone advise the best way to go about this?
I would appreciate anyone's help as I am a new excel user
Many thanks in advance.