What if you want to map custom regions in Excel 3D Map?
After yesterday's video importing KML files from the Census.Gov site, today, we take a look at creating your own KML file using Google Maps and then exporting it to Excel.
In today's example, I create a custom map of 10 neighborhood allotments.
Google Maps makes it easy to draw new polygons, name them, and then export the layer to KML. You can then import to Excel for Windows using 3D Maps.
Table of Contents
(0:00) Create custom shapes for Excel 3D Maps
(0:22) Neighborhood Allotments
(1:04) Open Google Maps
(1:34) Drawing a polygon for one jurisdiction in Google Maps
(2:40) Export polygons to KML in Google Maps
(3:00) Mapping in Excel with your custom jurisdictions
(4:37) Wrap-up

Transcript of the video:
Now let's create your own custom shapes for Excel 3D Map.
Yesterday, a question from PWRO.
"Is it possible to create a map with different jurisdictional boundaries?".
And so I showed how to use custom regions in a KML file that we downloaded from the Census Tracts.
But what if you're trying to do something else, a KML file that doesn't exist yet?
Like for example, these are neighborhood allotments here in my town.
And this goes back to a video, I can't believe I never posted this short video.
It's about three and a half minutes of this longer one hour webinar where I talked about using Excel for a home search using 3D Map.
And then I was able to add my custom jurisdictions to that map using this episode 2218, how to get two data sets on a map.
All right. So you want to create your own KML regions.
Maybe you're a golf course, you want to outline them each course.
Maybe you're a realtor, who knows?
You have some reason to do this, and it's easy to do in Google Maps. All right.
So here I am. I'm in Google Chrome.
I'm at Google Maps and I'm signed in.
In the top left menu here, Your Places, and there's four tabs across the top. Go to Maps, and then at the bottom Create a Map.
Give the map a name, and then zoom the map into the area that you want to do.
I'm going to just try zip code 32953, gets me pretty close.
Here, in these drawing tools, we're going to create a new shape by drawing a line, Add liner or shape, and we'll just draw an outline around one jurisdiction.
Feel free to click anytime you need to turn, and then close the polygon there. All right.
Now they want to know the name for that.
So this is Sykes Cove, and if you want to put a little description there, you can.
All right. And then close.
And then just click to draw the next line.
Now, rather than have you watch me draw all these lines, I already have all of the neighborhoods drawn in here, right?
So it looks like about 10 or 11 neighborhoods or so.
Sykes Creek Neighborhoods is the name of the map. I named the Layer to be Neighborhoods.
And then up here we're going to export to KML. And I want to export just the Neighborhoods.
I don't want to store it online. I'm going to export as KML instead of KMZ.
That seems to work really well, and it downloads this Neighborhoods.kml file.
That was easy. All right.
So let's try it back here in Excel, I have this data that I want to map based on those Neighborhoods.
So we'll insert a 3D Map just like in yesterday's video.
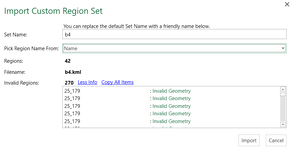
We have to import the customer regions, import a new set, Neighborhoods.kml is what we just exported from Google Maps, and name is the correct item. We'll click import.
All right.
So we're going to take the Neighborhood and add that as a location.
And then, of course, they don't understand Neighborhood. So come down here to custom region.
Beautiful.
We'll make this into a filled map area and the count will be the value.
All right.
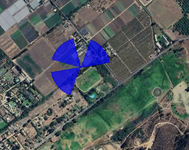
Now they all show up in different shades of blue based on the numbers.
So I'm going to take the Neighborhoods field and add it to category just to get us different colors.
All right. So there you go.
You have something that you want to map that doesn't currently exist.
It's not census data or something like that. It is easy to do.
Now, the weird thing here, when I turn on the Map Labels, it is not labeling those jurisdictions.
They're here in the legend.
And if I click on one or hover over one, it'll tell me the name of it.
But I can't seem to find a good way other than adding an annotation to each one.
Oh, not sure I want to do that, but at least on hover you can see the various map names.
Great news, it's easy to create your own KML file, create your own custom regions here.
I've seen that up there since 2013 and never actually tried it until today. It's really easy.
All right.
Well, hey, I want to thank you for stopping by and we'll see you next time for another NetCast from MrExcel.


