Calculating Average Server Times

AusKee

New Member
Joined
Jul 3, 2017
Messages
6
Hey Everyone,


I need to show a chart that displays between 0 & 120 Seconds (including milliseconds) for Server Loading times tested daily and, then average out the worst servers based upon the daily values entered.


In example;


06/15/2017 - 4.02 Seconds
06/16/2017 - 22.92 Seconds
06/17/2017 - 11.03 Seconds
06/18/2017 - 5.90 Seconds
06/19/2017 - 4.62 Seconds
Average Server Loading Time - 9.69 Seconds


I've tried it with time. but, it makes the graph & charts go crazy. It also seems to try and switch the numbers to an actual time as in 01/01/1901 00:10 AM which, also messes up the charts.


I then tried it as currency or a value(number) and even generic. But, it's always incorrectly displaying in charts & graphs.


What would be the best way to accomplish this?
 

Excel Facts

Last used cell?
Press Ctrl+End to move to what Excel thinks is the last used cell.
Is the data you posted exactly what you receive from a log file? I'll assume it is.


Excel 2012
ABCDE
1Log Text[?]Loading Times in SecondsMean
206/15/2017 - 4.02 Seconds06/154.029.69
306/16/2017 - 22.92 Seconds06/1622.929.69
406/17/2017 - 11.03 Seconds06/1711.039.69
506/18/2017 - 5.90 Seconds06/185.99.69
606/19/2017 - 4.62 Seconds06/194.629.69
7Average Server Loading Time - 9.69 Seconds
Sheet1
Cell Formulas
RangeFormula
C2=DATEVALUE(LEFT(A2, 10))
D2=--SUBSTITUTE(RIGHT(A2, LEN(A2) - 13), " Seconds", "")
E2=--SUBSTITUTE(RIGHT($A$7, LEN($A$7) - 30), " Seconds", "")

The dates in column C are Excel dates formatted as "mm/dd". The Loading Times and the Mean are simply decimal numbers. Select cells C1:E6 and Insert a Line Chart. You can then modify the vertical axis scale to have a fixed maximum of 120 seconds, if you wish.
 
Upvote 0
Is the data you posted exactly what you receive from a log file? I'll assume it is.

Excel 2012
ABCDE
Log Text[?]
06/15/2017 - 4.02 Seconds
06/16/2017 - 22.92 Seconds
06/17/2017 - 11.03 Seconds
06/18/2017 - 5.90 Seconds
06/19/2017 - 4.62 Seconds
Average Server Loading Time - 9.69 Seconds

<tbody>
[TD="align: center"]1[/TD]

[TD="align: right"][/TD]
[TD="align: right"][/TD]
[TD="align: right"]Loading Times in Seconds[/TD]
[TD="align: right"]Mean[/TD]

[TD="align: center"]2[/TD]

[TD="align: right"][/TD]
[TD="align: right"]06/15[/TD]
[TD="align: right"]4.02[/TD]
[TD="align: right"]9.69[/TD]

[TD="align: center"]3[/TD]

[TD="align: right"][/TD]
[TD="align: right"]06/16[/TD]
[TD="align: right"]22.92[/TD]
[TD="align: right"]9.69[/TD]

[TD="align: center"]4[/TD]

[TD="align: right"][/TD]
[TD="align: right"]06/17[/TD]
[TD="align: right"]11.03[/TD]
[TD="align: right"]9.69[/TD]

[TD="align: center"]5[/TD]

[TD="align: right"][/TD]
[TD="align: right"]06/18[/TD]
[TD="align: right"]5.9[/TD]
[TD="align: right"]9.69[/TD]

[TD="align: center"]6[/TD]

[TD="align: right"][/TD]
[TD="align: right"]06/19[/TD]
[TD="align: right"]4.62[/TD]
[TD="align: right"]9.69[/TD]

[TD="align: center"]7[/TD]

[TD="align: right"][/TD]
[TD="align: right"][/TD]
[TD="align: right"][/TD]
[TD="align: right"][/TD]

</tbody>
Sheet1

[TABLE="width: 85%"]
<tbody>[TR]
[TD]Worksheet Formulas[TABLE="width: 100%"]
<tbody>[TR="bgcolor: #DAE7F5"]
[TH]Cell[/TH]
[TH="align: left"]Formula[/TH]
[/TR]
[TR]
[TH="bgcolor: #DAE7F5"]C2[/TH]
[TD="align: left"]=DATEVALUE(LEFT(A2, 10))[/TD]
[/TR]
[TR]
[TH="bgcolor: #DAE7F5"]D2[/TH]
[TD="align: left"]=--SUBSTITUTE(RIGHT(A2, LEN(A2) - 13), " Seconds", "")[/TD]
[/TR]
[TR]
[TH="bgcolor: #DAE7F5"]E2[/TH]
[TD="align: left"]=--SUBSTITUTE(RIGHT($A$7, LEN($A$7) - 30), " Seconds", "")[/TD]
[/TR]
</tbody>[/TABLE]
[/TD]
[/TR]
</tbody>[/TABLE]


The dates in column C are Excel dates formatted as "mm/dd". The Loading Times and the Mean are simply decimal numbers. Select cells C1:E6 and Insert a Line Chart. You can then modify the vertical axis scale to have a fixed maximum of 120 seconds, if you wish.

Hi thisoldman,

Thanks for the response.
I may need more of a laymen's terms on how to do that. I am very new to excel lol


[TABLE="width: 1378"]
<colgroup><col><col><col><col><col><col><col><col><col><col><col></colgroup><tbody>[TR]
[TD]Date[/TD]
[TD]Server Name[/TD]
[TD]Citrix Server Loading[/TD]
[TD]DBM Server Loading Time[/TD]
[TD]Tech Initials[/TD]
[TD][/TD]
[TD]Row Labels[/TD]
[TD]Average of DBM Server Loading Time[/TD]
[TD][/TD]
[TD]Row Labels[/TD]
[TD]Average of Citrix Server Loading[/TD]
[/TR]
[TR]
[TD="align: right"]6/17/2017[/TD]
[TD]INTSVR001[/TD]
[TD="align: right"]5.62[/TD]
[TD="align: right"]3.89[/TD]
[TD]AK[/TD]
[TD][/TD]
[TD]INTSVR001[/TD]
[TD="align: right"]3.89[/TD]
[TD][/TD]
[TD]INTSVR001[/TD]
[TD="align: right"]5.62[/TD]
[/TR]
[TR]
[TD="align: right"]6/18/2017[/TD]
[TD]INTSVR002[/TD]
[TD="align: right"]3.89[/TD]
[TD="align: right"]5.62[/TD]
[TD]AK[/TD]
[TD][/TD]
[TD]INTSVR002[/TD]
[TD="align: right"]3.936[/TD]
[TD][/TD]
[TD]INTSVR002[/TD]
[TD="align: right"]5.074[/TD]
[/TR]
[TR]
[TD="align: right"]6/18/2017[/TD]
[TD]INTSVR002[/TD]
[TD="align: right"]4.62[/TD]
[TD="align: right"]2.39[/TD]
[TD]AK[/TD]
[TD][/TD]
[TD]Grand Total[/TD]
[TD="align: right"]3.91875[/TD]
[TD][/TD]
[TD]Grand Total[/TD]
[TD="align: right"]5.27875[/TD]
[/TR]
[TR]
[TD="align: right"]6/19/2017[/TD]
[TD]INTSVR001[/TD]
[TD="align: right"]5.62[/TD]
[TD="align: right"]3.89[/TD]
[TD]AK[/TD]
[TD][/TD]
[TD][/TD]
[TD][/TD]
[TD][/TD]
[TD][/TD]
[TD][/TD]
[/TR]
[TR]
[TD="align: right"]6/18/2017[/TD]
[TD]INTSVR002[/TD]
[TD="align: right"]5.62[/TD]
[TD="align: right"]3.89[/TD]
[TD]AK[/TD]
[TD][/TD]
[TD][/TD]
[TD][/TD]
[TD][/TD]
[TD][/TD]
[TD][/TD]
[/TR]
[TR]
[TD="align: right"]6/19/2017[/TD]
[TD]INTSVR001[/TD]
[TD="align: right"]5.62[/TD]
[TD="align: right"]3.89[/TD]
[TD]AK[/TD]
[TD][/TD]
[TD][/TD]
[TD][/TD]
[TD][/TD]
[TD][/TD]
[TD][/TD]
[/TR]
[TR]
[TD="align: right"]6/21/2017[/TD]
[TD]INTSVR002[/TD]
[TD="align: right"]5.62[/TD]
[TD="align: right"]3.89[/TD]
[TD]AK[/TD]
[TD][/TD]
[TD][/TD]
[TD][/TD]
[TD][/TD]
[TD][/TD]
[TD][/TD]
[/TR]
[TR]
[TD="align: right"]6/22/2017[/TD]
[TD]INTSVR002[/TD]
[TD="align: right"]5.62[/TD]
[TD="align: right"]3.89[/TD]
[TD]AK[/TD]
[TD][/TD]
[TD][/TD]
[TD][/TD]
[TD][/TD]
[TD][/TD]
[TD][/TD]
[/TR]
[TR]
[TD][/TD]
[TD][/TD]
[TD][/TD]
[TD][/TD]
[TD][/TD]
[TD][/TD]
[TD][/TD]
[TD][/TD]
[TD][/TD]
[TD][/TD]
[TD][/TD]
[/TR]
</tbody>[/TABLE]
 
Upvote 0
I see your data but I have no clue what you want to plot on your graphs. What is it that you are trying to show?
 
Upvote 0
I see your data but I have no clue what you want to plot on your graphs. What is it that you are trying to show?


The Average Citrix & DBM server load times.
Based on the averages of the data entered for each. Not to exceed a maximum of 120 Seconds.

Hope that helps :D
 
Upvote 0
I still don't understand. Why do you need a graph to show the average times? I could say it in a sentence or two: "The average time is x seconds." What else are you trying to show?
 
Upvote 0
I still don't understand. Why do you need a graph to show the average times? I could say it in a sentence or two: "The average time is x seconds." What else are you trying to show?


My Manager wants something "Visual" to look at and, be able to filter and show at presentations.
 
Upvote 0
Here's an attempt.

[TABLE="class: grid, width: 500"]
<tbody>[TR]
[TD="width: 40"]Date[/TD]
[TD="width: 64"]Citrix INTSVR001[/TD]
[TD="width: 64"]DBM INTSVR001[/TD]
[TD="width: 64"]Citrix INTSVR002[/TD]
[TD="width: 64"]DBM INTSVR002[/TD]
[TD="width: 64"]Mean Citrix[/TD]
[TD="width: 64"]Mean DBM[/TD]
[/TR]
[TR]
[TD="align: right"]06/17[/TD]
[TD="align: right"]5.62[/TD]
[TD="align: right"]3.89[/TD]
[TD][/TD]
[TD][/TD]
[TD="align: right"]5.28[/TD]
[TD="align: right"]3.92[/TD]
[/TR]
[TR]
[TD="align: right"]06/19[/TD]
[TD="align: right"]5.62[/TD]
[TD="align: right"]3.89[/TD]
[TD][/TD]
[TD][/TD]
[TD="align: right"]5.28[/TD]
[TD="align: right"]3.92[/TD]
[/TR]
[TR]
[TD="align: right"]06/19[/TD]
[TD="align: right"]5.62[/TD]
[TD="align: right"]3.89[/TD]
[TD][/TD]
[TD][/TD]
[TD="align: right"]5.28[/TD]
[TD="align: right"]3.92[/TD]
[/TR]
[TR]
[TD="align: right"]06/18[/TD]
[TD][/TD]
[TD][/TD]
[TD="align: right"]3.89[/TD]
[TD="align: right"]5.62[/TD]
[TD="align: right"]5.28[/TD]
[TD="align: right"]3.92[/TD]
[/TR]
[TR]
[TD="align: right"]06/18[/TD]
[TD][/TD]
[TD][/TD]
[TD="align: right"]4.62[/TD]
[TD="align: right"]2.39[/TD]
[TD="align: right"]5.28[/TD]
[TD="align: right"]3.92[/TD]
[/TR]
[TR]
[TD="align: right"]06/18[/TD]
[TD][/TD]
[TD][/TD]
[TD="align: right"]5.62[/TD]
[TD="align: right"]3.89[/TD]
[TD="align: right"]5.28[/TD]
[TD="align: right"]3.92[/TD]
[/TR]
[TR]
[TD="align: right"]06/21[/TD]
[TD][/TD]
[TD][/TD]
[TD="align: right"]5.62[/TD]
[TD="align: right"]3.89[/TD]
[TD="align: right"]5.28[/TD]
[TD="align: right"]3.92[/TD]
[/TR]
[TR]
[TD="align: right"]06/22[/TD]
[TD][/TD]
[TD][/TD]
[TD="align: right"]5.62[/TD]
[TD="align: right"]3.89[/TD]
[TD="align: right"]5.28[/TD]
[TD="align: right"]3.92[/TD]
[/TR]
</tbody>[/TABLE]

Prep
Formatted dates to "mm/dd"
Separated and sorted INTVR001 and INTSVR002
Added columns for the Means

Insert Line with marker chart
jwNlr8U.png


Format markers and lines
Removed markers for the two Means, lines to 1 pt
Removed lines for other series
Formatted marker shapes and colors
Removed Means from the legend
6lKLS3m.png


Add labels and move legend
Lvd5NZ7.png
 
Upvote 0
The only problem is separating the columns like that per server won't work. as, we have 263 (roughly, not including VS/VM) Servers.
I have it right now set up with data validation that checks to see if the server the "tech" typed in corresponds with an actual existing server.

Also, the images you posted seem to be broken :( I can't view them.

Thank you for helping with this :D I appreciate it :-)
 
Upvote 0

Forum statistics

Threads
1,223,888
Messages
6,175,205
Members
452,618
Latest member
Tam84

We've detected that you are using an adblocker.

We have a great community of people providing Excel help here, but the hosting costs are enormous. You can help keep this site running by allowing ads on MrExcel.com.
Allow Ads at MrExcel

Which adblocker are you using?

Disable AdBlock

Follow these easy steps to disable AdBlock

1)Click on the icon in the browser’s toolbar.
2)Click on the icon in the browser’s toolbar.
2)Click on the "Pause on this site" option.
Go back

Disable AdBlock Plus

Follow these easy steps to disable AdBlock Plus

1)Click on the icon in the browser’s toolbar.
2)Click on the toggle to disable it for "mrexcel.com".
Go back

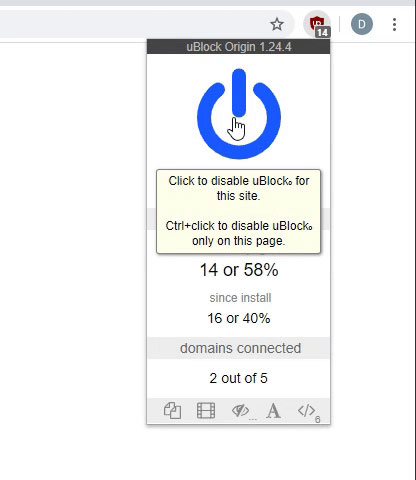
Disable uBlock Origin

Follow these easy steps to disable uBlock Origin

1)Click on the icon in the browser’s toolbar.
2)Click on the "Power" button.
3)Click on the "Refresh" button.
Go back

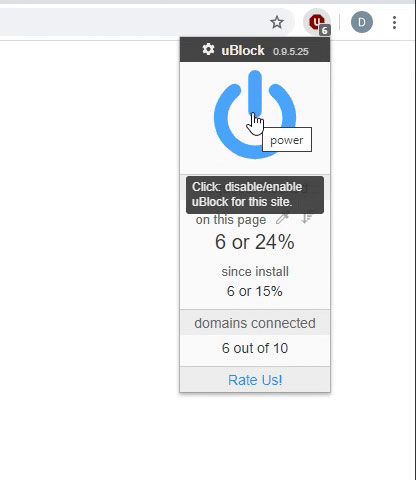
Disable uBlock

Follow these easy steps to disable uBlock

1)Click on the icon in the browser’s toolbar.
2)Click on the "Power" button.
3)Click on the "Refresh" button.
Go back
Back
Top