| Average.xlsx |
|---|
|
|---|
| A | B | C | D | E | F | G |
|---|
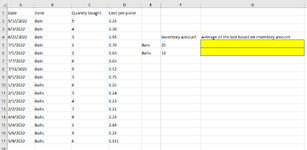
| 1 | Date | Item | Quanity bought | Cost per piece | | | |
|---|
| 2 | 5/10/2022 | Bats | 5 | 1.25 | | | |
|---|
| 3 | 6/3/2022 | Bats | 4 | 1.36 | | | |
|---|
| 4 | 6/23/2022 | Bats | 3 | 1.95 | | Inventory Amount | Average of the last based on Inventory amount |
|---|
| 5 | 7/1/2022 | Bats | 1 | 1.78 | Bats | 25 | |
|---|
| 6 | 7/1/2022 | Bats | 2 | 1.63 | Balls | 18 | |
|---|
| 7 | 7/7/2022 | Bats | 8 | 3.65 | | | |
|---|
| 8 | 7/18/2022 | Bats | 9 | 1.52 | | | |
|---|
| 9 | 8/1/2022 | Bats | 3 | 1.75 | | | |
|---|
| 10 | 1/3/2022 | Balls | 8 | 1.25 | | | |
|---|
| 11 | 2/1/2022 | Balls | 3 | 1.24 | | | |
|---|
| 12 | 2/1/2022 | Balls | 4 | 1.23 | | | |
|---|
| 13 | 2/2/2022 | Balls | 7 | 1.21 | | | |
|---|
| 14 | 4/4/2022 | Balls | 9 | 2.23 | | | |
|---|
| 15 | 5/4/2022 | Balls | 1 | 2.89 | | | |
|---|
| 16 | 5/6/2022 | Balls | 3 | 1.23 | | | |
|---|
| 17 | 5/9/2022 | Balls | 6 | 1.111 | | | |
|---|
|
|---|
.
I want to get the average cost of the last 25 bats I bought. If we would only have 20 bats on inventory i would want the average of only the last 20 that we bought.